Part 1The Number You Can't Feel
The skeptical reader is thinking: "Here comes the oldest deficit trick in politics. Turn the government into a family, point at the credit-card bill, and hope nobody notices countries are not families."
Correct. That trick has a rap sheet.
A household has to earn dollars before it spends them. The federal government issues the currency its debt is denominated in. A household eventually dies and settles the estate. The United States can roll old debt into new debt for as long as lenders keep showing up. A household cannot tax a continent. A government can. So if this essay used a kitchen-table budget to argue that the country must "pay off the card" the way a family does, the essay would deserve to be thrown out before the first drawing.
But there is another thing the kitchen table can do. It can make a flow visible.
In fiscal year 2025, the federal government collected $5.235T — written out, $5,235,000,000,000 a year, a number your eye slides straight off. We are going to shrink that to exactly $100,000. At that scale, $1T becomes $19,103.60. Scaled dollar amounts are rounded the way the ledger rounds them: nearest $100 above $1,000, nearest $10 below.1
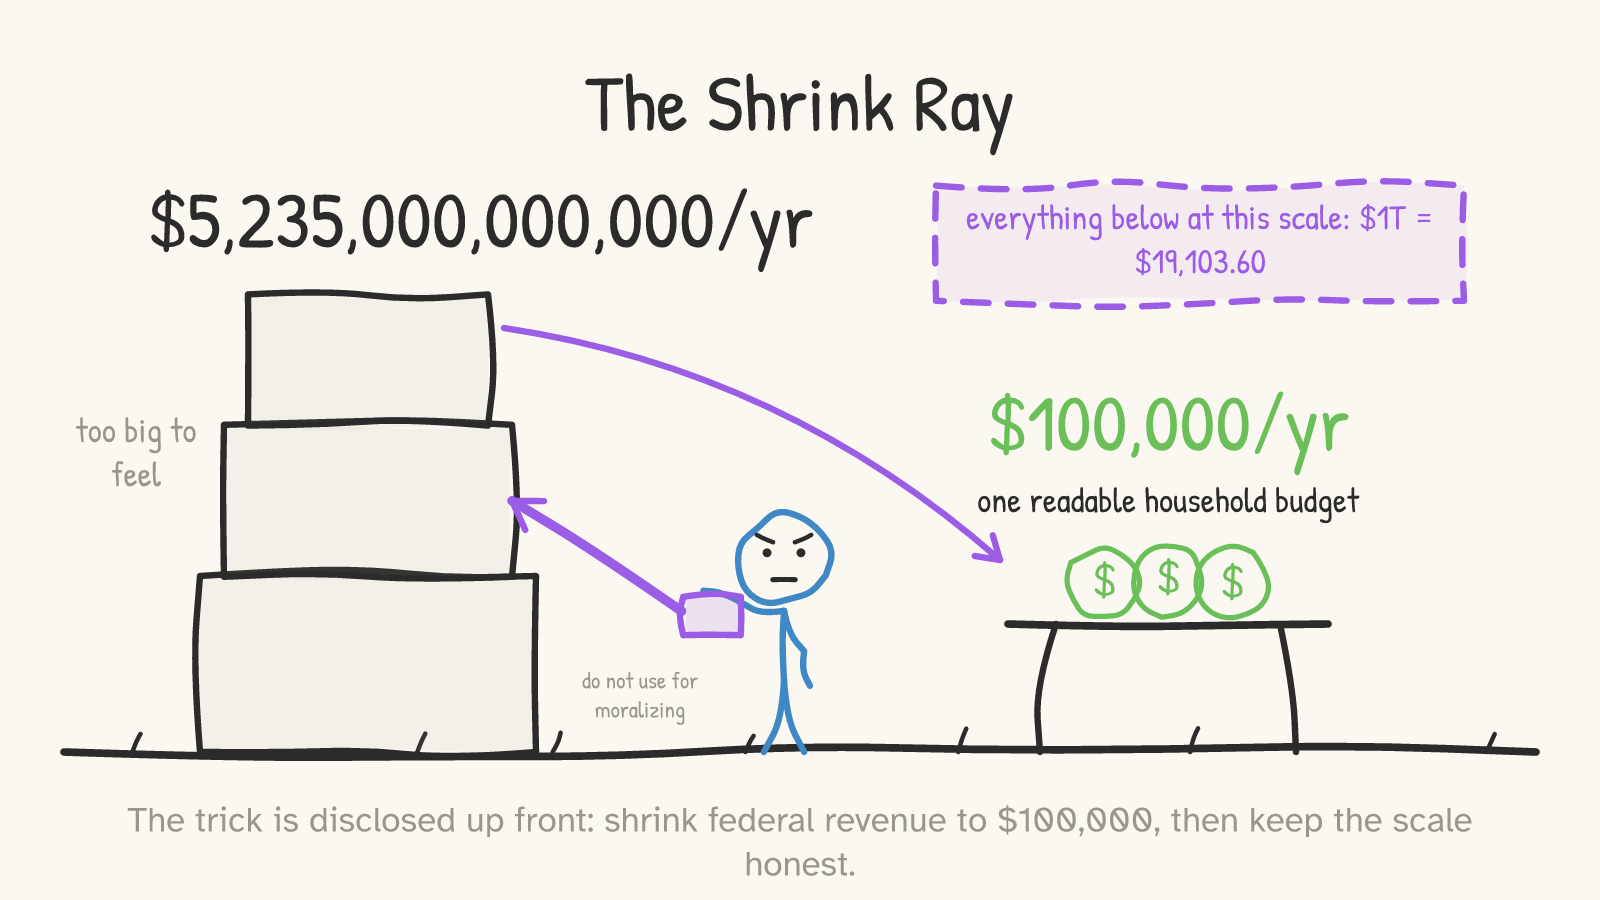
The rule is simple: the stock side of the analogy is suspect; the flow side is useful. We will not pretend the balance comes due all at once. We will keep asking what the annual lines are large enough to crowd, and what the budget can no longer fit easily around them.
Part 2The Paycheck
The skeptical reader is thinking: "Fine. If the government earns $100,000 in this model, where does the paycheck actually come from?"
Mostly from people getting paid.
The $100,000 is not a mysterious national allowance. It is receipts. Individual income taxes supply $50,700. Payroll and social-insurance taxes supply $33,400. Corporate income taxes supply $8,600. Customs duties, the tariff line people argue about as if it is the whole budget, supply $3,700. Everything else supplies $3,500.2 3 4 5 6
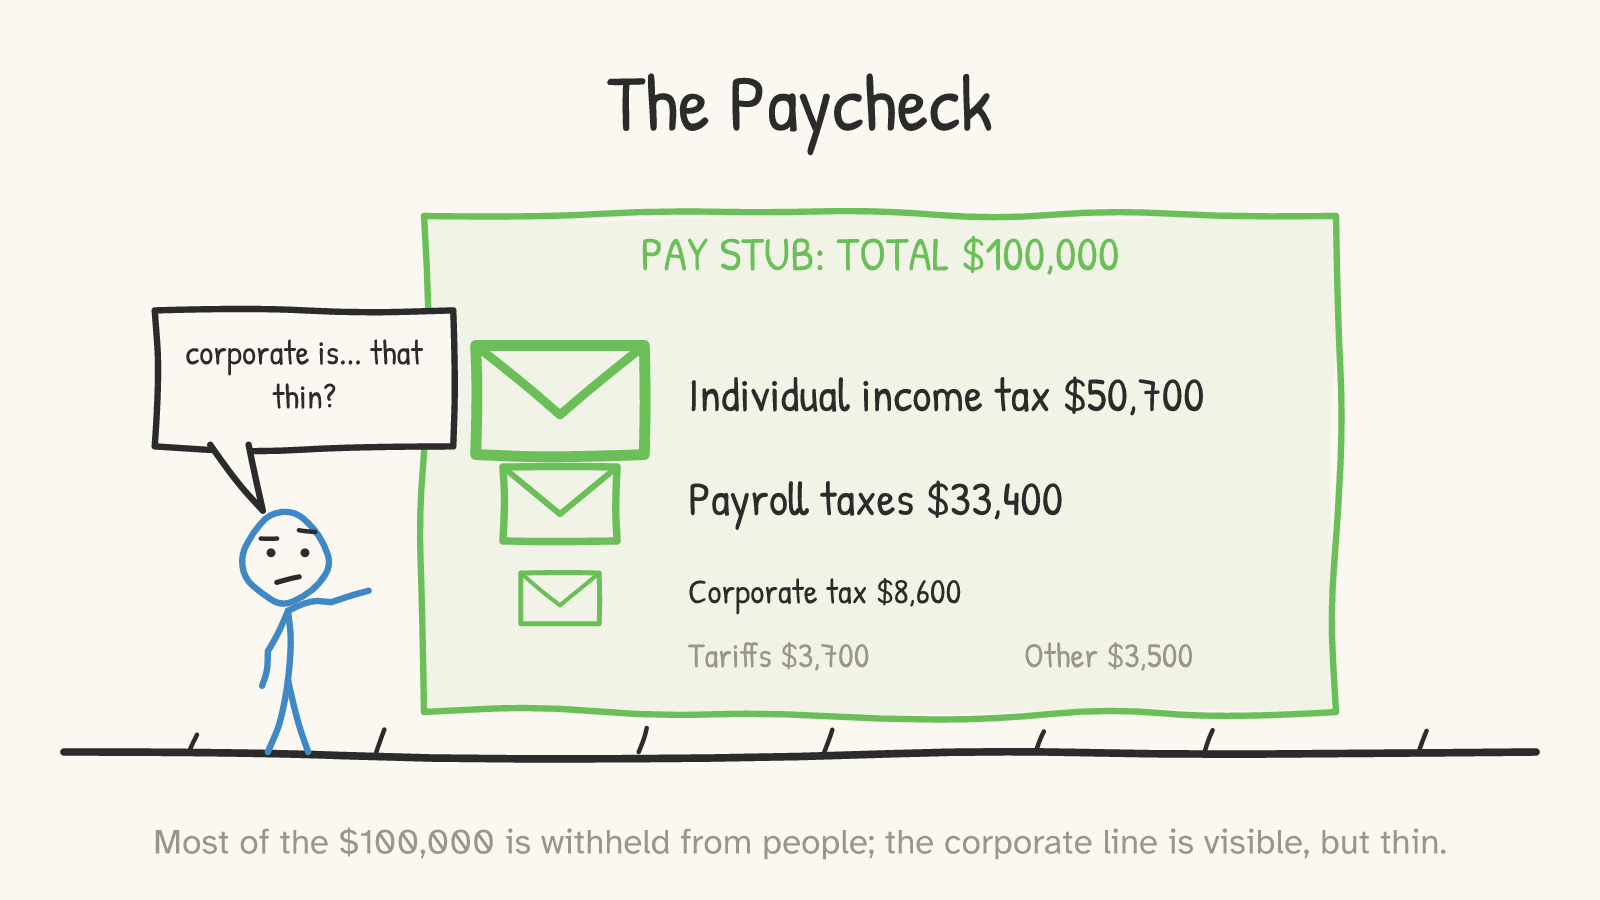
Two surprises usually land here. One is that the payroll-derived lines are huge. The other is that corporate income taxes are not. That does not mean corporations are irrelevant to public finance, or that corporate-tax incidence is simple, or that tariff policy is unimportant. It means that on the cash ledger of FY2025 receipts, the big green envelopes are the taxes tied most directly to individual paychecks.
Now the household has its income. Put a thick green line at $100,000.
Then stack the bills.
Part 3The Bills
The skeptical reader is thinking: "This is where you hide all the politics in categories."
The categories matter, so here they are in the open. At the $100,000 scale, FY2025 federal outlays were $133,900. Social Security was $30,100. Medicare was $18,900. Non-defense discretionary spending was $18,700. Net interest was $18,500. Other mandatory programs were $17,800. Defense discretionary spending was $17,100. Medicaid was $12,800.7 8 9 10 11 12 13 14
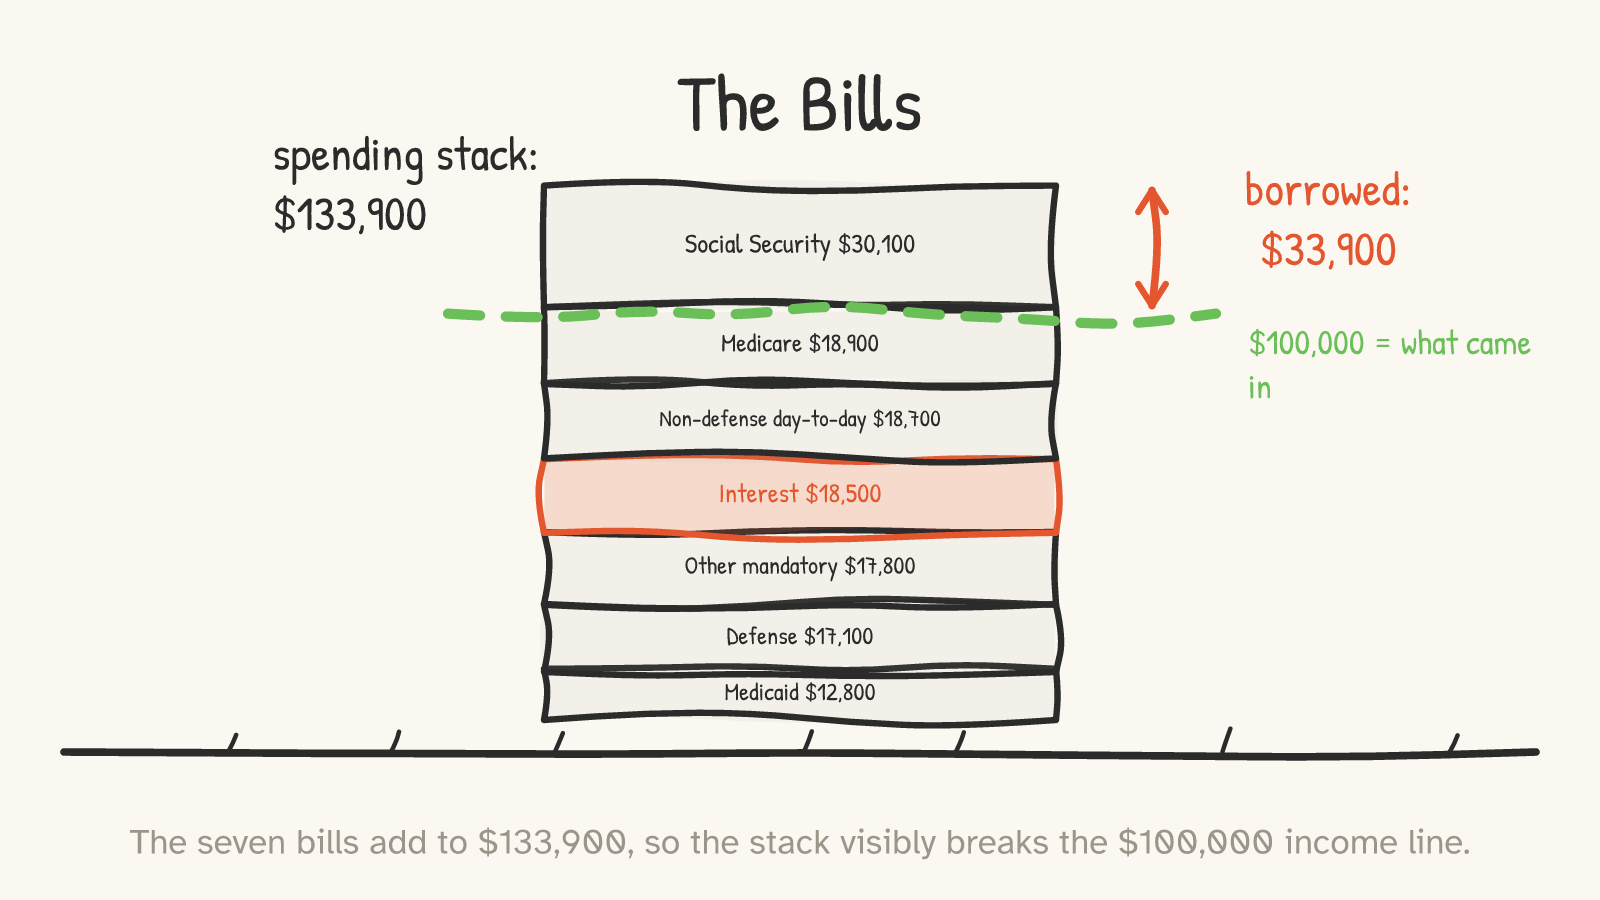
The household earned $100,000 and spent $133,900. The borrowed gap was $33,900.15 Of that deficit, $18,500 corresponded to net interest and about $15,400 was the primary deficit: current non-interest policy was also adding to future debt.12 16
That sentence is not a policy conclusion. It does not tell you which line is too big, which tax is too low, which program is sacred, or which program is badly designed. It only establishes the shape of the room: the budget is not a pile of tiny optional luxuries plus one obvious villain. It is a few giant promises, a large daily operating budget, a black-box-sounding "other mandatory" bucket that includes income security, veterans' benefits, federal retirement, premium tax credits, and student loans, and a red line called interest that already looks too large to be background scenery.11
The natural next question is: who is choosing all of this each year?
Part 4The Autopilot
The skeptical reader is thinking: "Congress spends the money. If voters want a smaller deficit, Congress can just stop."
Some of it can. Congress can change the big pile too, but mostly by changing the underlying law: benefit formulas, eligibility rules, provider payments, and program design. That is a different act than trimming the ordinary annual appropriations pile.
Defense discretionary spending is $17,100. Non-defense discretionary spending is $18,700. Together, the part Congress most visibly re-chooses each year is about $35,800. The other giant lines are mostly formulas, benefit commitments, eligibility rules, and interest on past borrowing.8 9 10 11 12 13 14
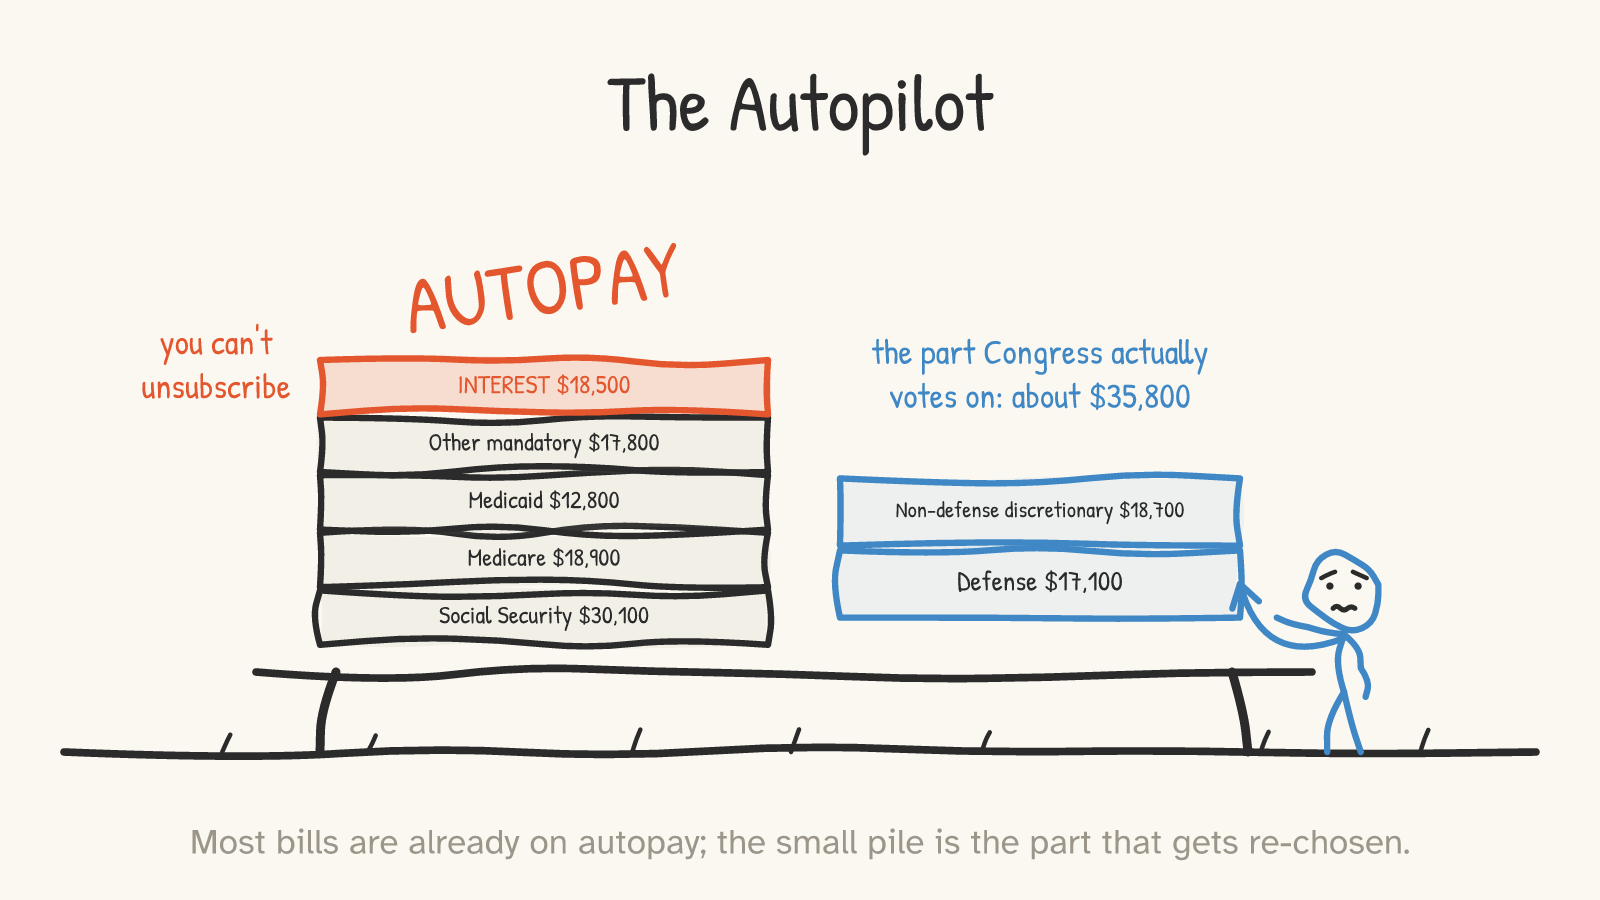
This is why "cut spending" is both true and evasive. If someone means trimming the small pile, they should say what happens when $35,800 is the visible target and the deficit is $33,900. If someone means changing the big pile, they should say they mean benefits, eligibility, provider payments, tax expenditures embedded in program design, or the interest bill. The phrase "waste, fraud, and abuse" may exist, but it does not add a secret eighth block to the panel.
Interest is the weirdest autopay item because it is not a program service. It is not retirement income. It is not health care. It is not a ship, a road, a lab, a ranger station, or a tax credit. It is the financing cost of having already spent more than came in.
And it is the line that starts moving.
Part 5The Interest Line
The skeptical reader is thinking: "Interest is always in these essays because it sounds scary. Is it actually the story, or just the red crayon?"
It is one of the central stories because it changed shape so fast.
At this same FY2025 scale, net interest was $6,600 in FY2020. In FY2025 it was $18,500. That is +181.5%. The FY2020 value is deliberately scaled using the FY2025 revenue factor, so the comparison is apples-to-apples inside this miniature budget, not a separate miniature with a different denominator.17
As a share of each year's own receipts, the rise is less theatrical but still large: net interest went from 10.1% of FY2020 receipts to 18.5% of FY2025 receipts.18
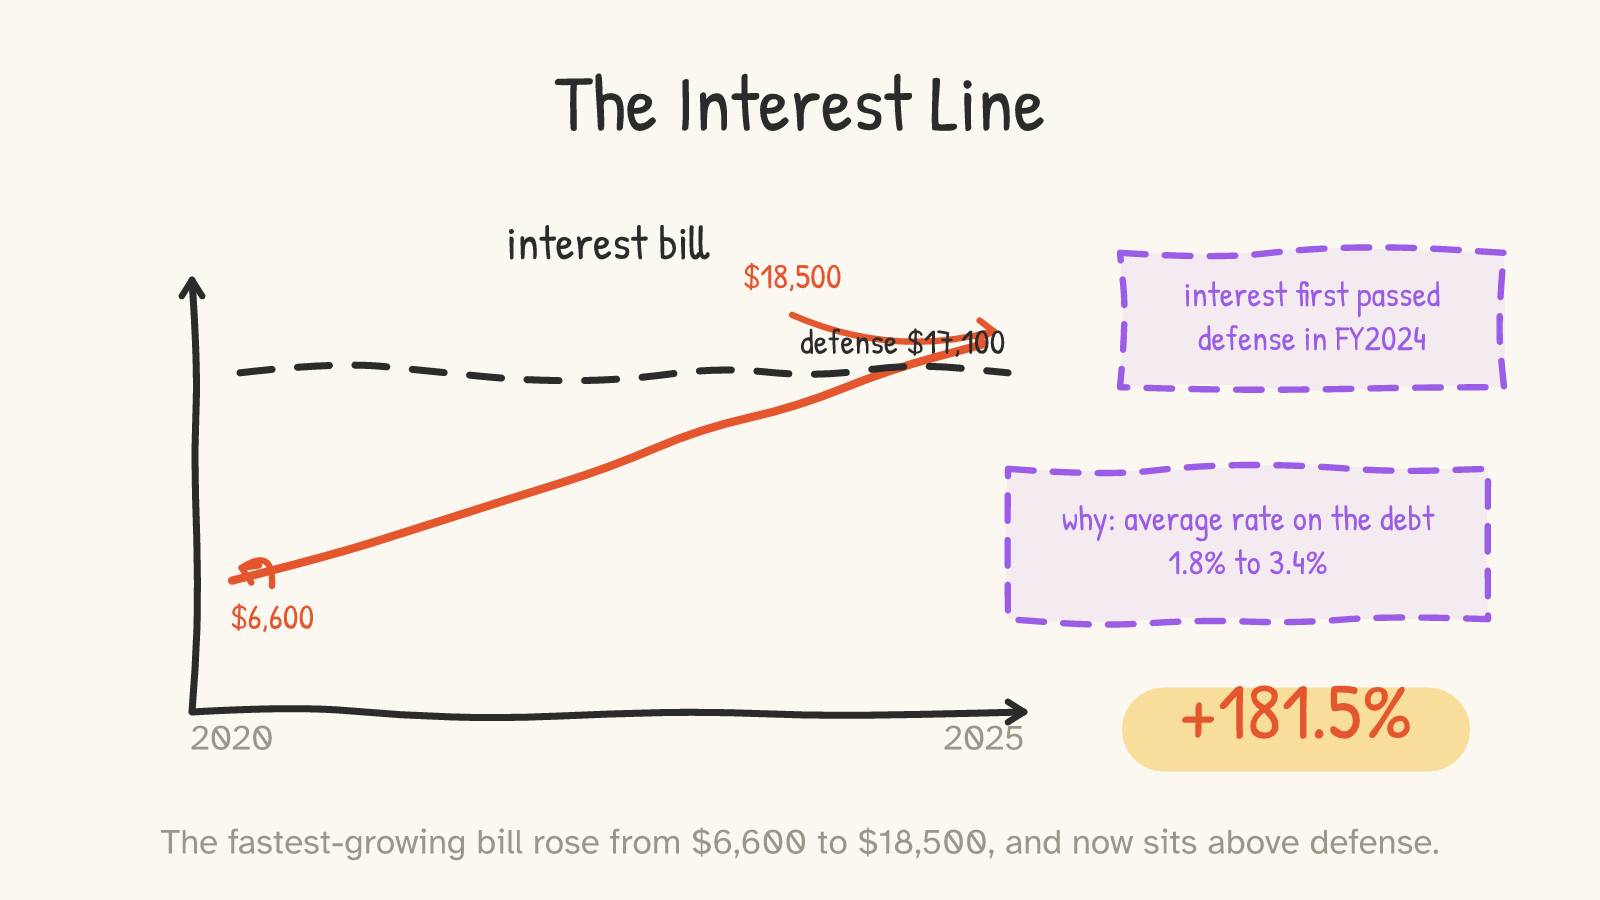
Why did it jump? Partly because the balance got larger, and partly because the average interest rate on interest-bearing Treasury debt rose from 1.8% to 3.4%.19
It also crossed a symbolic line. Using the Treasury's MTS national-defense function, net interest first exceeded national defense in FY2024; by FY2025, net interest was $970.4B versus $916.6B for that function.20 Separately, the panel's defense reference bar is the CBO defense-discretionary category, $17,100 at this scale.13 Those are different definitions, kept in different sentences because mixing them is how budget arguments get mushy.
If you prefer the unshrunk version, FY2025 net interest was about $30,770 per second.21 That number is vivid, but it is not the key one. The key one is scale-free: net interest equaled 18.5% of receipts.22
Now we can look at the balance behind it without pretending the balance is the whole argument.
Part 6The Balance
The skeptical reader is thinking: "Here it comes: the big scary stock number."
Yes. But with the label in capital letters: stock, not flow.
At the end of FY2025, debt held by the public was $30.278T. On the $100,000-revenue scale, that is $578,400. The deficit added $33,900 this year, and the interest paid this year was $18,500. The broader gross federal debt was $719,000 at this scale, which means the government also owed itself another $140,600 through intragovernmental holdings.15 23 24 12
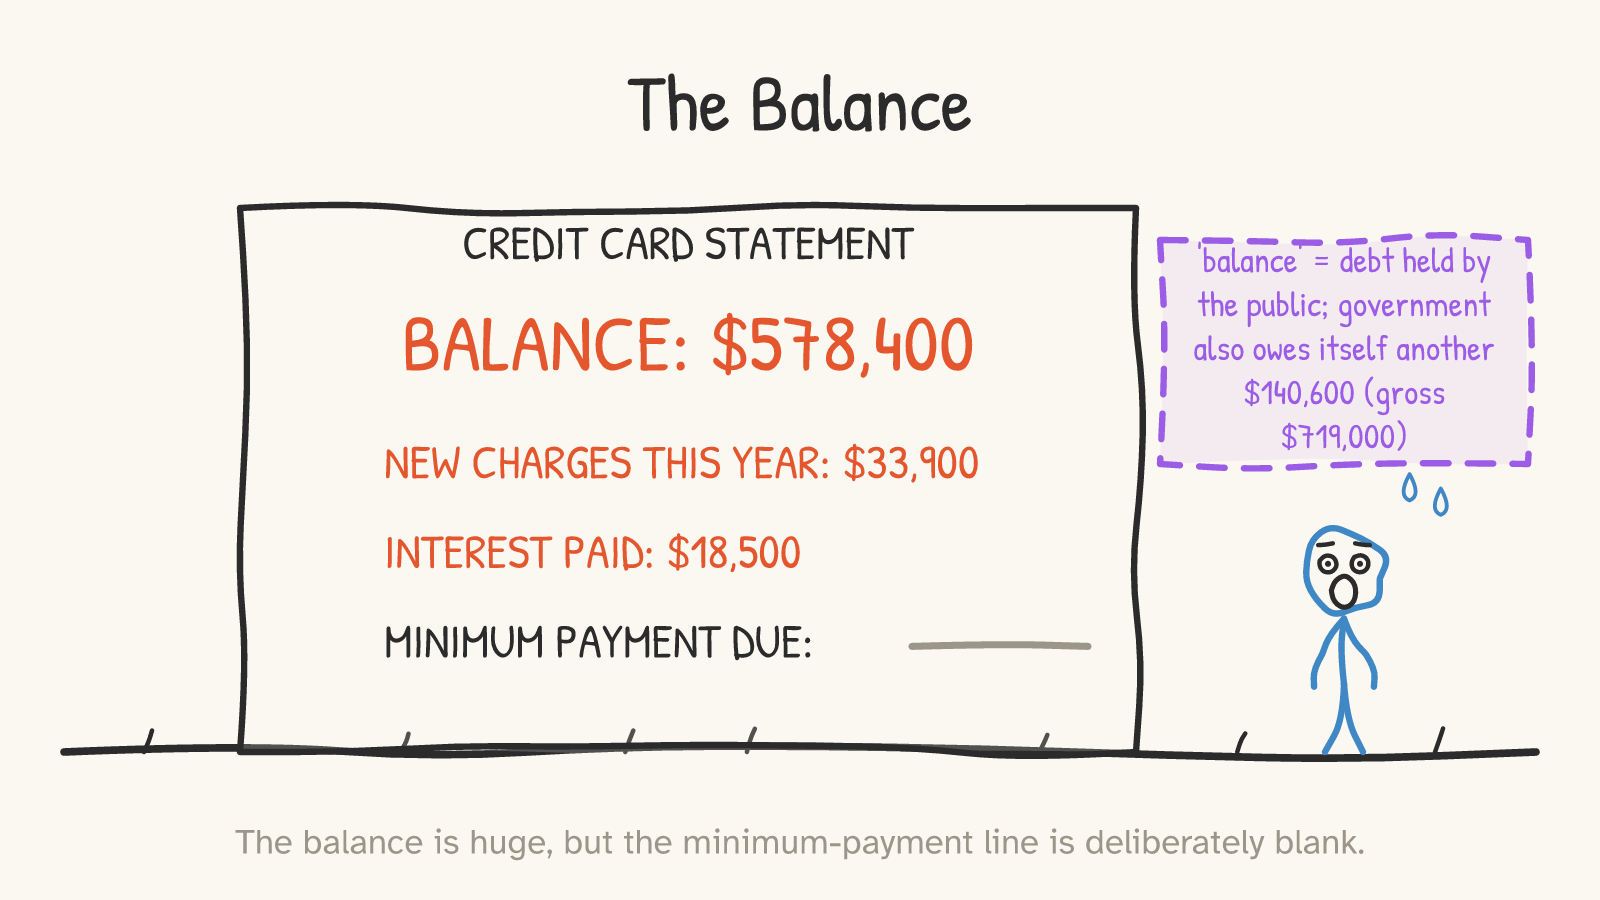
The blank line matters. A family with $100,000 of income and a $578,400 balance has a lender with a very specific opinion about next month. The United States has Treasury auctions, a central bank, tax authority, deep capital markets, and debt that gets refinanced rather than settled like an estate. The country does not wake up with a household-style minimum payment demanding the whole balance.
So do not read $578,400 as "the income should cover the stock this year." That would be the wrong denominator. The cleaner denominator is the economy: debt held by the public was 99.8% of GDP.25 That is high, but it is not the same claim as "a family owes several years of salary," and this essay is not going to smuggle that claim through the back door.
Debt-to-GDP is the cleaner measure for the stock. Interest-to-receipts is a fiscal-capacity measure for the annual flow. The essay uses each for its own job, not whichever one makes the scarier poster.
The balance matters because it feeds the interest line. The interest line matters because it is an annual outlay.
Now give the other side its strongest turn.
Part 7The Part Where the Analogy Breaks
The skeptical reader is thinking: "Finally. Because the shrink ray itself is the trick."
That objection is fair, and it is the best objection.
"A sovereign currency issuer is not a household. It can roll over debt indefinitely. It never has to pay the whole stock down. It can tax. Its revenue base grows with the economy. The right denominator is debt-to-GDP, not dollars on a fake credit-card statement. Japan carries about 204% of GDP in gross debt and still functions. If nominal growth is running 5.38% while the 10-year Treasury yield is 4.16%, the debt ratio can stabilize without a heroic payoff crusade. And a lot of debt held by the public is held at home: 55.6% by domestic non-Fed holders and 13.9% by the Fed itself. 'We owe it to ourselves' is not a slogan. It is partly true."25 26 27 28 29
Conceded. Conceded cleanly.
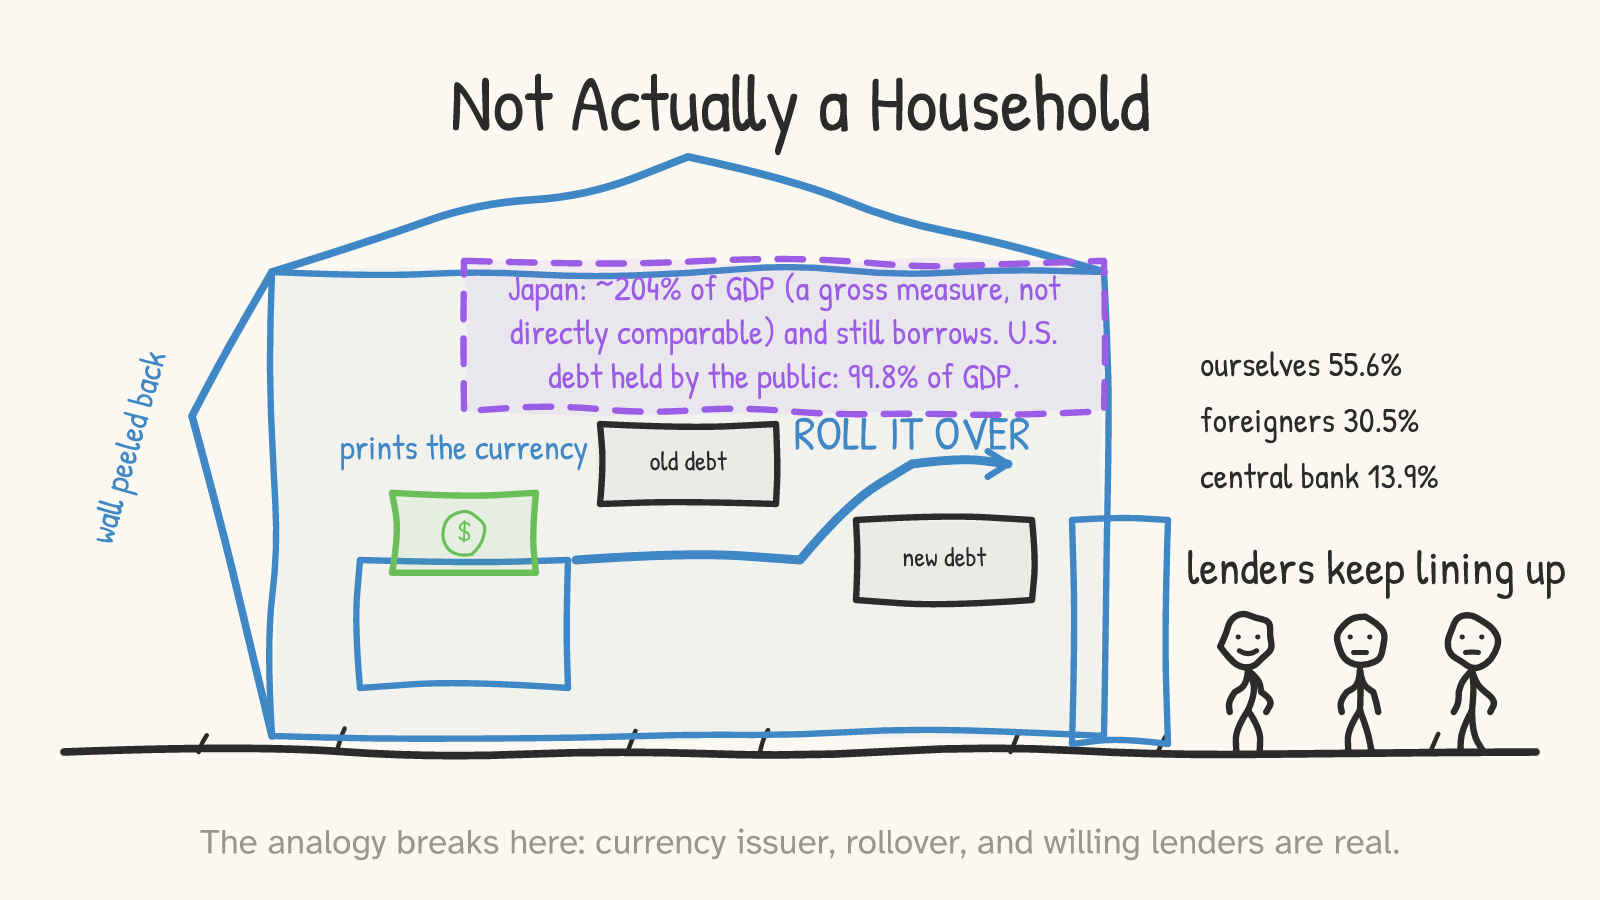
First answer: the stock analogy breaks. The United States does not need to save up $578,400 in this miniature and mail it to a cosmic collections department. It rolls debt over. It taxes. It borrows in its own currency. It can have debt near annual GDP without the mechanical household crisis the kitchen-table metaphor wants you to imagine.27
Second answer: those concessions change the question; they do not erase it. "We owe it to ourselves" has content, because of debt held by the public at the end of September 2025, 30.5% was held by foreign holders, 13.9% by the Fed, and 55.6% by the domestic non-Fed residual. But interest still creates distributional and budgetary flows: payments flow from the Treasury to holders of Treasury securities; over time they must be accommodated through some mix of taxes, spending, inflation, monetary operations, or additional borrowing.29
Third answer, bluntest: the interest line is a flow. The flow survives the concession. Even if the stock never comes due all at once, even if debt-to-GDP is the right scoreboard, even if Japan — on a gross general-government measure that is not directly comparable to America's debt-held-by-the-public figure — proves the ceiling can be much higher, net interest still equaled $18,500 on the $100,000 receipts scale.12 22 26
And the r-versus-g comfort has its own fine print. Debt dynamics depend on the effective interest rate on the whole debt stock, the growth rate, and the primary deficit, not just the 10-year yield versus one year's nominal growth. Growth outrunning rates helps; it does not stabilize the ratio by itself when the primary deficit is still $15,400 at this scale.16 19 28
Even the flow analogy has limits: in a deficit year, receipts do not literally fund particular lines. The point is scale, not dollar tracing.
That is why the shrink ray is allowed to stay. Not because it turns a currency issuer into a family. Because after all the correct macroeconomics has finished yelling at the metaphor, the red block is still 18.5% of receipts.
Part 8The Line That Survives
The skeptical reader is thinking: "So what are you actually asking me to believe?"
Not doom. Not that the country is a family. Not that the balance comes due like a credit-card bill. Not that every borrowed dollar is foolish, or that every tax dollar is painless, or that the only responsible politics is a spreadsheet with the color drained out of it.
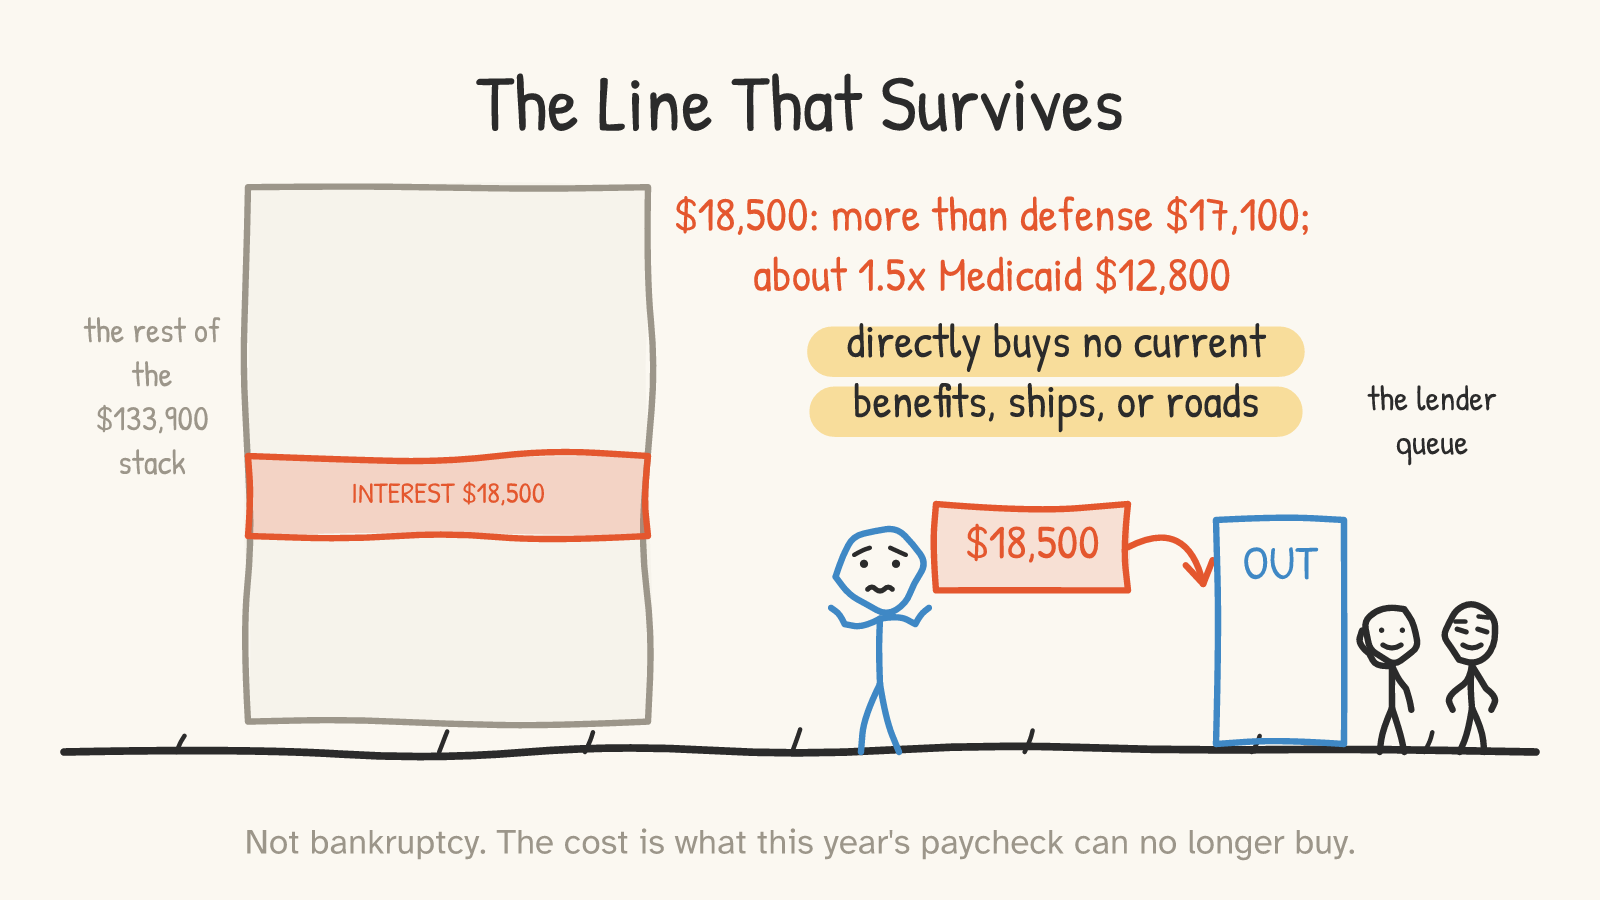
The claim is narrower and harder to dodge: in FY2025, after shrinking federal receipts to $100,000, net interest equaled $18,500. That was 18.5% of receipts. It was more than the $17,100 defense-discretionary line in the panel. It was about 1.5 times the $12,800 Medicaid line; the exact ratio was 1.45.12 22 13 14 30
Absent higher borrowing, higher taxes, or lower other spending, an interest line that large crowds the rest of the budget.
This is not an argument that interest is immoral. Treasury securities are also savings vehicles, collateral, safe assets, pension assets, bank assets, foreign-reserve assets, and plumbing for the global financial system. A world with no Treasury market would not be a cleaner version of this one. It would be a different machine.
But the interest line has a brutal simplicity. It does not directly buy a current Social Security check. It does not directly buy a current Medicare treatment. It does not directly buy a current Medicaid visit, defense readiness, or non-defense day-to-day public service. It compensates holders of past borrowing.
That is the protagonist of the story. Not the $578,400 balance by itself. Not the $33,900 deficit by itself. The line where the past walks into the current budget as an $18,500 claim on fiscal capacity, and leaves everyone else to argue over the room that remains.
The household analogy is dangerous when it pretends the balance must be paid like a family's. It is useful when it lets you see the bills on the table. The honest conclusion is not panic. It is attention: if the interest line keeps growing, the choice is not whether to pay it. The choice is which future public thing gets crowded, which tax rises, which promise changes, or which new borrowing feeds the next version of the same red line.
That is what survives the shrink ray.
Footnotes & receipts
- Total FY2025 revenue and scale factor: Treasury Fiscal Data Monthly Treasury Statement Table 9, record_date=2025-09-30, total receipts $5,234,616,386,315.43. Methodology: set that exact receipt total equal to $100,000, so $100,000 / $5,234,616,386,315.43 = 0.0000000191035966382225 and $1T = $19,103.60; scaled dollars round to nearest $100 above $1,000 and nearest $10 below. Rounded receipt components may not sum to exactly $100,000. (tier 2) ↩
- Individual income taxes: Treasury Fiscal Data Monthly Treasury Statement Table 9, record_date=2025-09-30, Individual Income Taxes $2,656,044,447,275.63; scaled by the footnote 1 factor to $50,700. Methodology/scope: net receipts. (tier 2) ↩
- Payroll/social-insurance taxes: Treasury Fiscal Data Monthly Treasury Statement Table 4, FY2025 Total -- Social Insurance and Retirement Receipts $1,748,293,811,962.85; scaled to $33,400. Methodology/scope: employment/general retirement, unemployment insurance, and other retirement receipts. (tier 2) ↩
- Corporate income taxes: Treasury Fiscal Data Monthly Treasury Statement Table 9, Corporation Income Taxes $452,089,303,419.78; scaled to $8,600. Methodology/scope: net receipts. (tier 2) ↩
- Customs duties/tariffs: Treasury Fiscal Data Monthly Treasury Statement Table 9, Customs Duties $194,865,739,872.82; scaled to $3,700. Methodology/scope: customs duties only, not all trade-related revenue. (tier 2) ↩
- Other revenue: Treasury Fiscal Data Monthly Treasury Statement Table 9 component rows, excise taxes $105.936B + estate/gift taxes $29.462B + miscellaneous receipts $47.925B = $183.324B; scaled to $3,500. Methodology/scope: derived subtotal from listed receipt categories. (tier 2) ↩
- Total FY2025 outlays: Treasury Fiscal Data Monthly Treasury Statement Table 9, total net outlays $7,009,973,667,049.30; scaled to $133,900. Methodology/scope: final MTS cash-budget outlays. Reconciliation note: the seven displayed components use CBO spending buckets while the total uses Treasury MTS; rounded components happen to sum to the rounded total, while the CBO buckets (each rounded by CBO to the nearest $1B) sum to about $7.008T versus MTS $7.010T, with the difference absorbed in rounding. (tier 2) ↩
- Social Security outlays: CBO, Mandatory Spending in FY2025 infographic, Social Security $1,575B; scaled to $30,100. Methodology/scope: CBO rounded category, used for consistency with mandatory-spending buckets. (tier 2) ↩
- Medicare outlays: CBO, Mandatory Spending in FY2025 infographic, Medicare net of offsetting receipts $988B; scaled to $18,900. Methodology/scope: CBO rounded category. (tier 2) ↩
- Non-defense discretionary outlays: CBO, Discretionary Spending in FY2025 infographic, Nondefense $980B; scaled to $18,700. Methodology/scope: CBO rounded discretionary category. (tier 2) ↩
- Other mandatory outlays: CBO, Mandatory Spending in FY2025 infographic, derived from rounded CBO components other than Social Security, Medicare, and Medicaid: premium tax credits $140B + other major health $23B + income security $397B + student loans -$86B + veterans $251B + retirement $210B + other programs $177B - non-Medicare offsetting receipts $178B = $934B; scaled to $17,800. Methodology/scope: derived subtotal from rounded CBO components. (tier 2) ↩
- Net interest outlays: Treasury Fiscal Data Monthly Treasury Statement Table 9, Net Interest $970,358,886,994.32; scaled to $18,500. Methodology/scope: net interest, not gross interest on Treasury securities; CBO FY2025 budget infographic cross-check says $970B. (tier 2) ↩
- Defense discretionary outlays: CBO, Discretionary Spending in FY2025 infographic, Defense $893B; scaled to $17,100. Methodology/scope: CBO rounded discretionary category, narrower than the MTS national-defense function. (tier 2) ↩
- Medicaid outlays: CBO, Mandatory Spending in FY2025 infographic, Medicaid $668B, cross-checked against MTS Table 5 Grants to States for Medicaid $668.139B; scaled to $12,800. Methodology/scope: CBO rounded category. (tier 2) ↩
- FY2025 deficit: Treasury Fiscal Data Monthly Treasury Statement Table 3, record_date=2025-09-30, Surplus (+) or Deficit (-) = -$1,775,357,280,733.87; shown as positive magnitude and scaled to $33,900. Methodology/scope: MTS cash-budget deficit. (tier 2) ↩
- Primary deficit FY2025: real $805.0B, derived as deficit $1,775.4B minus net interest $970.4B; scaled to $15,400. Methodology/scope: derived from Treasury Fiscal Data Monthly Treasury Statement Table 3 deficit and Table 9 net interest. (tier 2) ↩
- Historical net interest: Treasury Fiscal Data Monthly Treasury Statement Table 9, Net Interest $344.7B for FY2020 and $970.4B for FY2025; scaled to $6,600 and $18,500 using the FY2025 revenue scale, with growth +181.5%. Methodology/scope: FY2020 is deliberately scaled by the FY2025 factor for same-essay comparability. (tier 2) ↩
- FY2020 receipts & interest share: FY2020 total receipts $3.420T ($3,419,955,005,765.34); FY2020 net interest $344.7B = 10.1% of FY2020 receipts, versus 18.5% in FY2025. Methodology/scope: Treasury Fiscal Data Monthly Treasury Statement Table 9, record_date=2020-09-30; share uses each year's own receipts. (tier 2) ↩
- Average interest rate on debt: Treasury Fiscal Data, Average Interest Rates on U.S. Treasury Securities, Total Interest-bearing Debt on 2020-09-30 and 2025-09-30: 1.772% and 3.363%, rendered in text and panel as 1.8% and 3.4%. Methodology/scope: average rate on total interest-bearing Treasury debt, not a dollar line. (tier 2) ↩
- Net interest versus national defense: Treasury Fiscal Data Monthly Treasury Statement Table 9; FY2025 net interest $970.4B versus MTS national-defense function $916.6B, with FY2024 cross-check net interest $881.651B versus national defense $874.041B. Methodology/scope: first fiscal year in MTS Table 9 history where net interest exceeded the national-defense function was FY2024; this is separate from CBO defense discretionary in footnote 13. (tier 2) ↩
- Interest per second: Treasury Fiscal Data Monthly Treasury Statement Table 9 Net Interest $970.4B/year divided by 31,536,000 seconds = about $30,770 per second. Methodology/scope: 365-day fiscal year; vivid comparison only. (tier 2) ↩
- Net interest as a share of revenue: Treasury Fiscal Data Monthly Treasury Statement Table 9 exact values, $970.359B / $5.235T = 18.54%, rendered as 18.5%; scaled expression is $18,500 out of the $100,000 receipts budget. Methodology/scope: computed from exact MTS values before rounding. (tier 2) ↩
- Debt held by the public: Treasury Debt to the Penny, 2025-09-30, debt_held_public_amt $30,277,766,440,770.58; scaled to $578,400. Methodology/scope: stock value at fiscal year end, not annual spending. (tier 2) ↩
- Gross federal debt: Treasury Debt to the Penny, 2025-09-30, tot_pub_debt_out_amt $37,637,553,494,935.61; scaled to $719,000. Methodology/scope: total public debt outstanding, including intragovernmental holdings; the $140,600 internal amount is the rounded scaled difference between gross debt and debt held by the public. (tier 2) ↩
- Debt held by the public as a share of GDP: CBO Monthly Budget Review, Summary for FY2025, states debt held by the public rose to 99.8% of GDP; Treasury provides the $30.278T stock used elsewhere. Methodology/scope: CBO's GDP denominator. (tier 2) ↩
- Japan higher-debt example: IMF World Economic Outlook DataMapper, April 2026, Japan general-government gross debt 204.4% of GDP for 2025; Japan Ministry of Finance FY2025 public-finance fact sheet gives central+local long-term debt expected at 211% of GDP. Methodology/scope: steelman texture, not a direct U.S. budget comparator; definitions differ. (tier 2/3) ↩
- Household-analogy critique: University of Sydney explainer on U.S. debt limits and Treasury Fiscal Data national-debt guide. Methodology/scope: institutional synthesis that a sovereign currency issuer can roll over debt and is constrained by inflation, rates, confidence, and political capacity rather than a literal household checking-account balance. (tier 3) ↩
- r-versus-g framing: Treasury Daily Treasury Par Yield Curve Rates, 10-year Treasury yield 4.16% on 2025-09-30; FRED/BEA GDP series, nominal GDP Q3 2025 $31.098T versus Q3 2024 $29.512T, growth 5.38%. Methodology/scope: backward-looking nominal GDP growth comparison and end-FY market rate, not a long-run forecast. (tier 2) ↩
- Who holds debt held by the public: Treasury Debt to the Penny for total public-held debt at the end of September 2025; Treasury TIC Table 5, September 2025 foreign holdings $9.2375T; Federal Reserve H.4.1, 2025-10-01, Treasury securities held outright $4.196385T. Methodology/scope: shares are of debt held by the public as of end-September 2025: foreign holders 30.5%, Fed 13.9%, domestic non-Fed residual 55.6%; Fed value is closest Wednesday one day after fiscal year end. (tier 2) ↩
- Interest versus Medicaid: Treasury Fiscal Data Monthly Treasury Statement Table 9 net interest $970.4B and CBO Mandatory Spending infographic Medicaid $668.0B; scaled values $18,500 and $12,800, exact ratio 1.45. Methodology/scope: Medicaid value rounded to nearest $1B by CBO; body rounds ratio to "about 1.5 times." (tier 2) ↩