Somewhere today, an American got into a car and didn't get out of it.
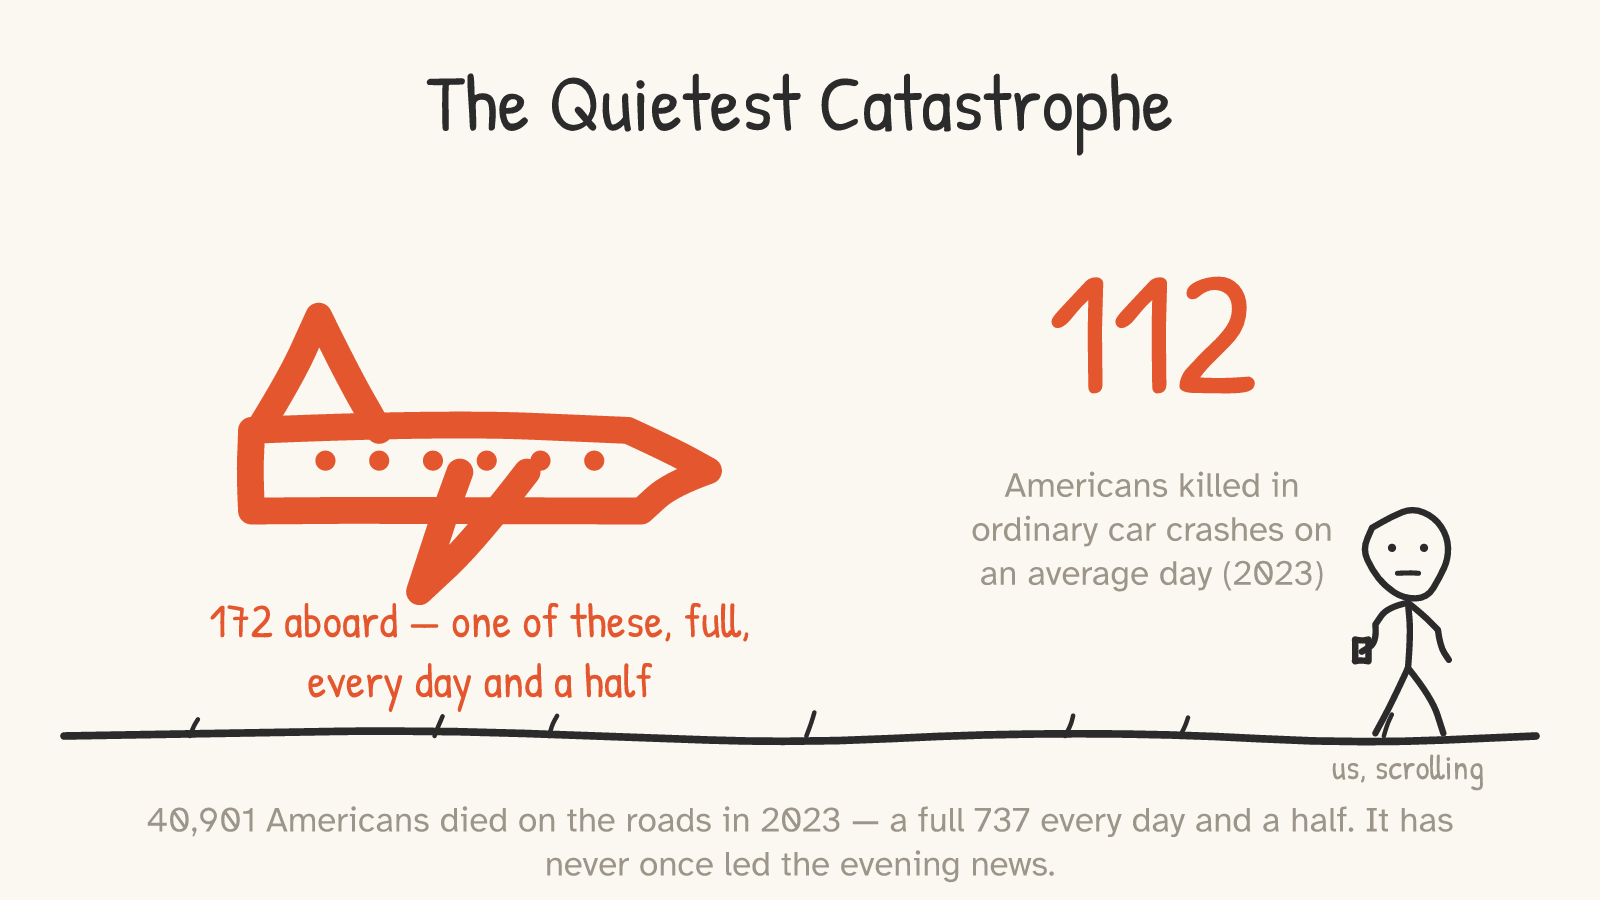
Then it happened again, about thirteen minutes later. Then again. It will happen roughly 112 times today, and 112 times tomorrow, and it has happened at about that pace every day for years: 40,901 people died on US roads in 2023.1 That's a fully loaded 737 — every seat taken — going down with no survivors every day and a half. Globally it's about 1.19 million people a year,2 which works out to a Boeing's worth of human beings every seventy-five minutes.
If actual planes were doing this, we would ground the fleet by lunchtime. For cars, it has never once led the evening news. We gave the catastrophe a name that makes it sound like weather — "traffic fatalities" — and we built it into the price of living here. Another 2.4 million Americans were injured on the roads in 2023,1 and the only reason none of this feels like an emergency is that it has been happening since before you were born.
This essay makes one argument, and it's going to be careful about it: opposing self-driving cars is not the safe position. It feels safe the way all status quos feel safe — because the deaths it preserves are already priced in, and the deaths it prevents would have been caused by something new. But "familiar" and "safe" are different words, and the gap between them is currently running at about 112 Americans a day.
The argument is not "trust the robot companies." They have, as we'll see, given you genuinely excellent reasons not to. The argument is that the strongest honest reading of the evidence — discounted for every real methodological sin the skeptics have caught — still says the robots crash less than we do. And if that's true, then the burden of proof has been sitting on the wrong side of the scale.
Part 1Meet the benchmark
Here's the thing the phrase "safer than a human driver" hides: which human driver?
When you imagine the driving the robot has to beat, you imagine yourself — rested, sober, both hands somewhere respectable, eyes up. But the robot isn't being graded against you at your best. It's being graded against the actual averaged output of humanity behind the wheel, and the actual averaged output of humanity behind the wheel includes some people having a very bad night.
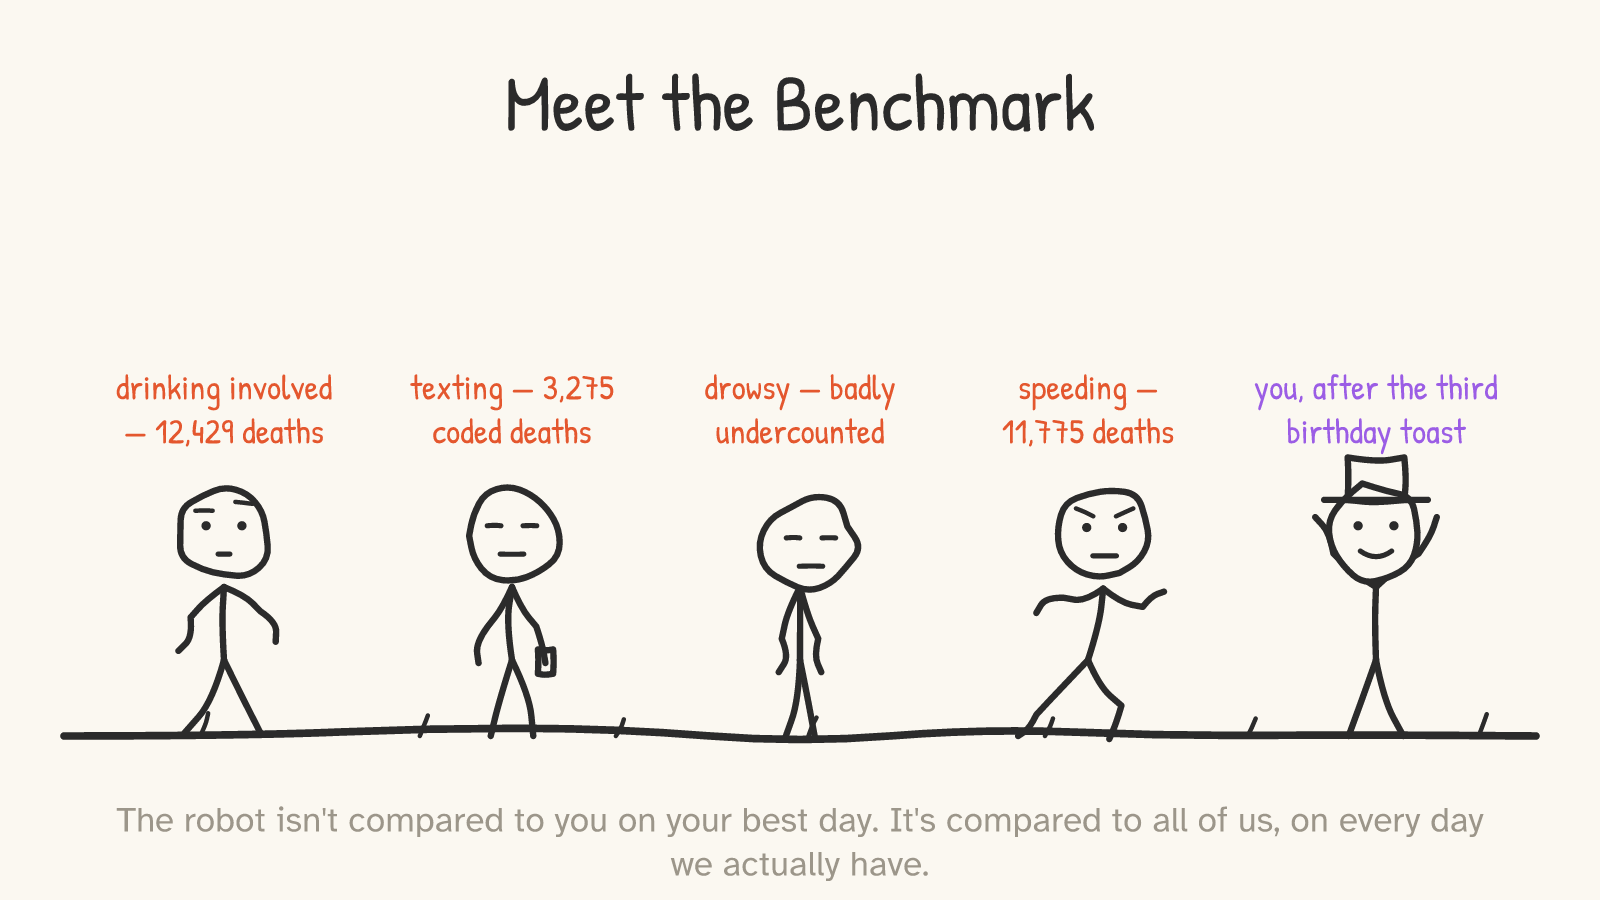
Of 2023's 40,901 deaths, 12,429 — about 30% — involved a driver over the legal alcohol limit.3 11,775 — about 29% — were coded as speeding-related.4 (Those categories overlap — a drunk driver doing 95 is in both counts — so don't add them; the point is the lineup, not a sum.) Police reports attributed 3,275 deaths to distracted driving, and NHTSA itself will tell you that number is badly undercounted — studies that check phone records instead of asking drivers put true distraction involvement at several times the police-coded rate.5 Drowsy driving is coded on under 2% of fatal crashes and almost certainly involved in many times that, because "I was asleep" is not a thing survivors volunteer and corpses can't.5
(A number you may be expecting here: "94% of crashes are caused by human error." We're not going to use it, and you shouldn't either. It comes from a 2005–2007 federal crash survey that coded the driver as the last event in the causal chain — the "critical reason" — in 94% of sampled crashes, and the agency that published it explicitly warns it doesn't mean humans were the sole cause.6 The honest version of the point doesn't need the inflated stat: the lineup above is doing fine on its own.)
None of this is contempt for human drivers. You and I are in the lineup too — everyone who has driven home tired from a hospital shift, or glanced at the phone because the text might be the babysitter, is in the lineup. That's the point. The benchmark isn't a slur; it's an average. And the average includes the worst hours of the best people.
So the question "is the robot safer than a human?" was always the wrong question. The right question is: is the robot safer than all of us put together, including the 30% line and the asleep line? That's a much lower bar than your self-image — which is exactly why it's worth asking seriously whether a machine has cleared it.
Part 2The robot's report card
Here is the best evidence that exists, with its limitations attached in the same breath.
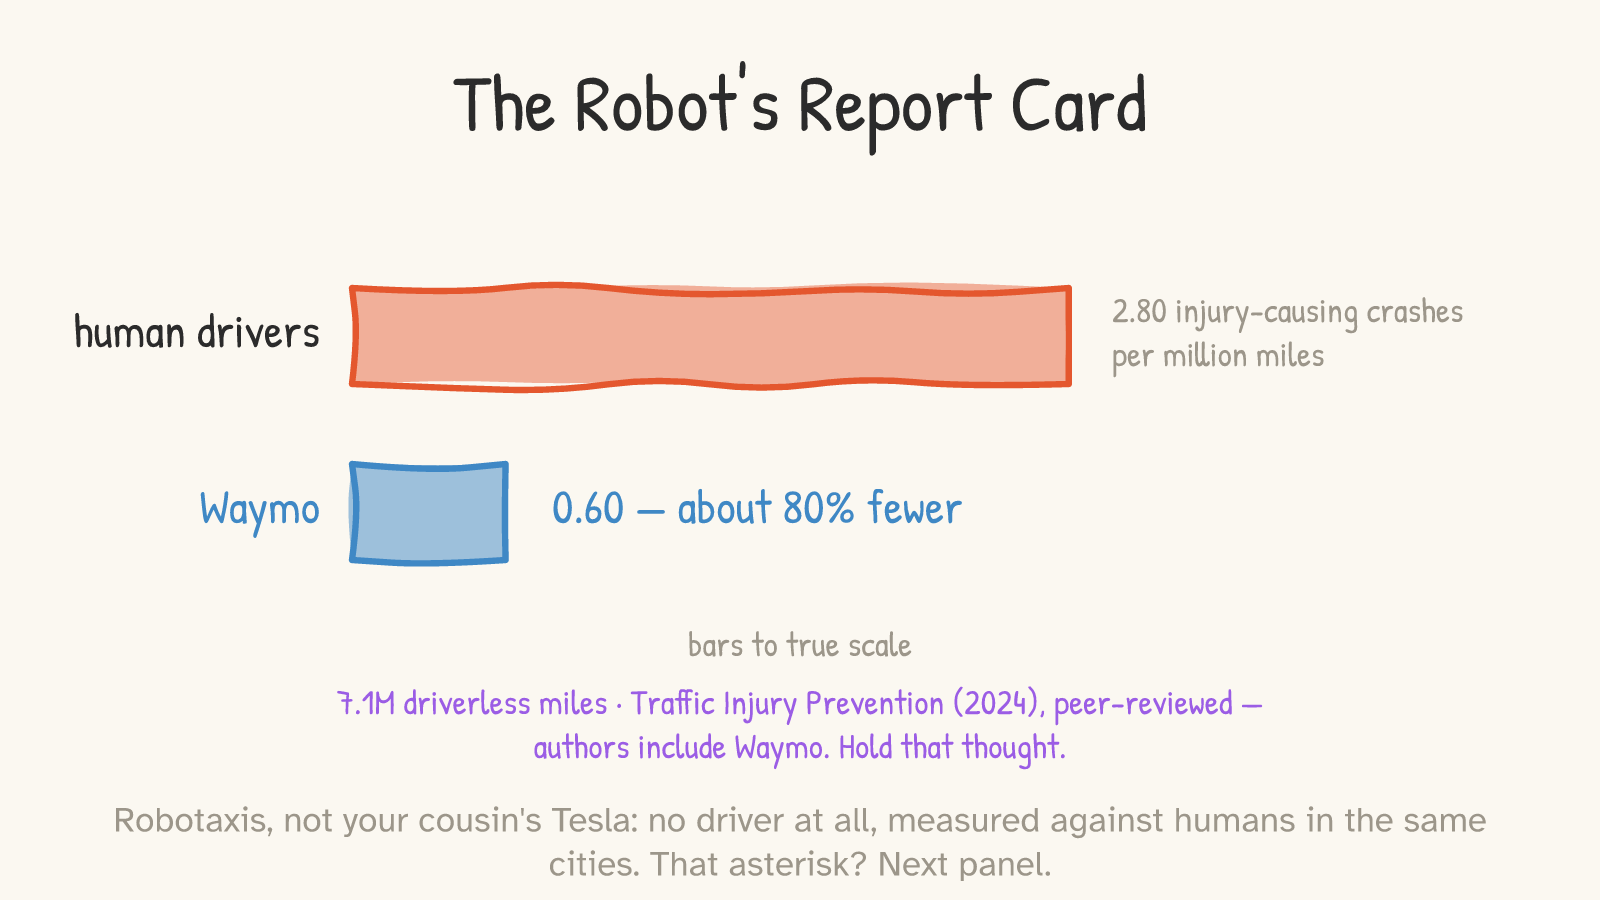
The only safety study of driverless crash rates to clear peer review — co-authored by Waymo's own researchers, with the raw data staying proprietary; both facts matter and we'll come back to them — compared Waymo's first 7.1 million rider-only miles — no safety driver, no human backup in the seat — against human crash benchmarks built for the same cities it operates in. Result: 0.60 injury-causing crashes per million miles, versus 2.80 for the human benchmark — roughly 80% fewer. Police-reported crashes of any severity were down about 55%.7
A second, differently-shaped check: Waymo and the reinsurer Swiss Re compared the robot's insurance claims — what actual claimants actually filed — against Swiss Re's baseline built from over 500,000 human claims across 200 billion miles of driving. Over Waymo's first 25.3 million driverless miles: two bodily-injury claims, where the human baseline predicted twenty-six — a 92% reduction — plus 88% fewer property-damage claims.8 And before you object that the human baseline includes ancient Corollas with no crumple zones: run it against only late-model cars loaded with automatic emergency braking and the rest of the modern driver-assist suite, and the reductions barely budge — 90% and 86%.8 Claims data matters because a claim is filed by the person the robot hit, not by the robot's marketing department — though let's keep the asterisk attached: Swiss Re is Waymo's reinsurer and co-published the study with them. It's the strongest non-company count that exists, which is not the same thing as an audit.
And the headline number: Waymo passed 100 million driverless miles by mid-2025,9 with no fatal crash documented in which the system was determined to be the cause as of this writing (mid-2026 — a time-stamped claim, deliberately).10 That sentence is doing precise work, so let's be precise about its edges: in January 2025 a human driver doing roughly 98 mph rear-ended a stopped Waymo in San Francisco and set off a chain collision that killed a man and his dog, with the human driver detained for vehicular manslaughter. The robot was hit; it did not do the hitting.10 There is exactly one pedestrian death on public roads directly attributed to an autonomous system's own behavior — Elaine Herzberg, killed in 2018 by an Uber test vehicle. The car's factory emergency braking had been switched off to avoid conflicts with Uber's own software, Uber's own braking logic failed to classify her as a pedestrian in time, and the safety driver was watching a video. The NTSB faulted the system's design, the driver's inattention, and Uber's safety culture, all three.11 It was a real AV death and a real scandal, and it belongs to a test program that no longer exists — not to the driverless services running today.
One more cut that the public debate keeps botching, so we'll make it cleanly: none of the above is about Tesla. "Autopilot" and "Full Self-Driving" are SAE Level 2 driver-assistance — the human is the driver, legally and functionally, every second. The robotaxis in this essay are Level 4: there is no one to hand control back to. When you read that Autopilot was active in hundreds of crashes and dozens of deaths — 736 crashes and 17 deaths in one Washington Post analysis of federal data through 202212 — you are reading about a driver-assist feature and the humans who over-trusted it. That's a real problem. It is a different problem. Lumping the two is how you get a public that believes "a self-driving car" has already killed dozens of people, when the driverless services have killed, on the best current accounting, zero. (And yes, the line is blurring on purpose: Tesla's Austin "robotaxi" pilot launched in 2025 running supervised FSD — legally and functionally still Level 2, whatever the branding. If it certifies as Level 4 someday, it graduates into this essay's subject and inherits the same report-card demands.)12
Part 3The part where you shouldn't trust them
Now the other side of the ledger, stated as strongly as its best advocates state it — because they're right about more than is comfortable.
Concede it. All true. The peer review was real but the data pipeline belongs to the company; the Swiss Re analysis is the closest thing to an outside count and even that was published by Waymo, not by Swiss Re independently.8 There is, as of mid-2026, no independent academic audit of any robotaxi fleet anywhere. That is a scandal of regulatory design, and you should be angry about it.
Concede most of it. The operational-design-domain critique is the strongest methodological card the skeptics hold. The Kusano benchmarks try to control for it — they're built from human crash rates in the same counties the robot drives13 — but "same counties" is not "same trips," and nobody serious claims today's results generalize to a Montana blizzard. The honest claim is narrower: within the places robotaxis actually operate, against humans driving in those same places, the robot crashes much less. Since those places are dense cities — where 7,314 American pedestrians died in 202314 — "narrower" is not "small."
Concede it entirely — and notice what's left. Yes: at fatality level, the jury is still out, and anyone telling you "proven 10x safer on deaths" is ahead of the data. But injury crashes and insurance claims are not rare events; at those levels the statistics are real, the reductions are large, and every additional million miles tightens them. The defensible sentence is: proven much safer on the things we can measure; consistent with much safer on the thing we can't yet.
Yes. October 2, 2023, San Francisco: a human hit-and-run driver struck a pedestrian and threw her into the path of a Cruise robotaxi. The Cruise braked — then executed a pull-over maneuver with a person under the car, dragging her about twenty feet. And then the company showed regulators footage that conveniently stopped before the dragging. California's DMV called it what it was — a lack of candor — and suspended Cruise's permits; federal regulators fined the company; GM eventually shut the whole division down, roughly $10 billion in.16
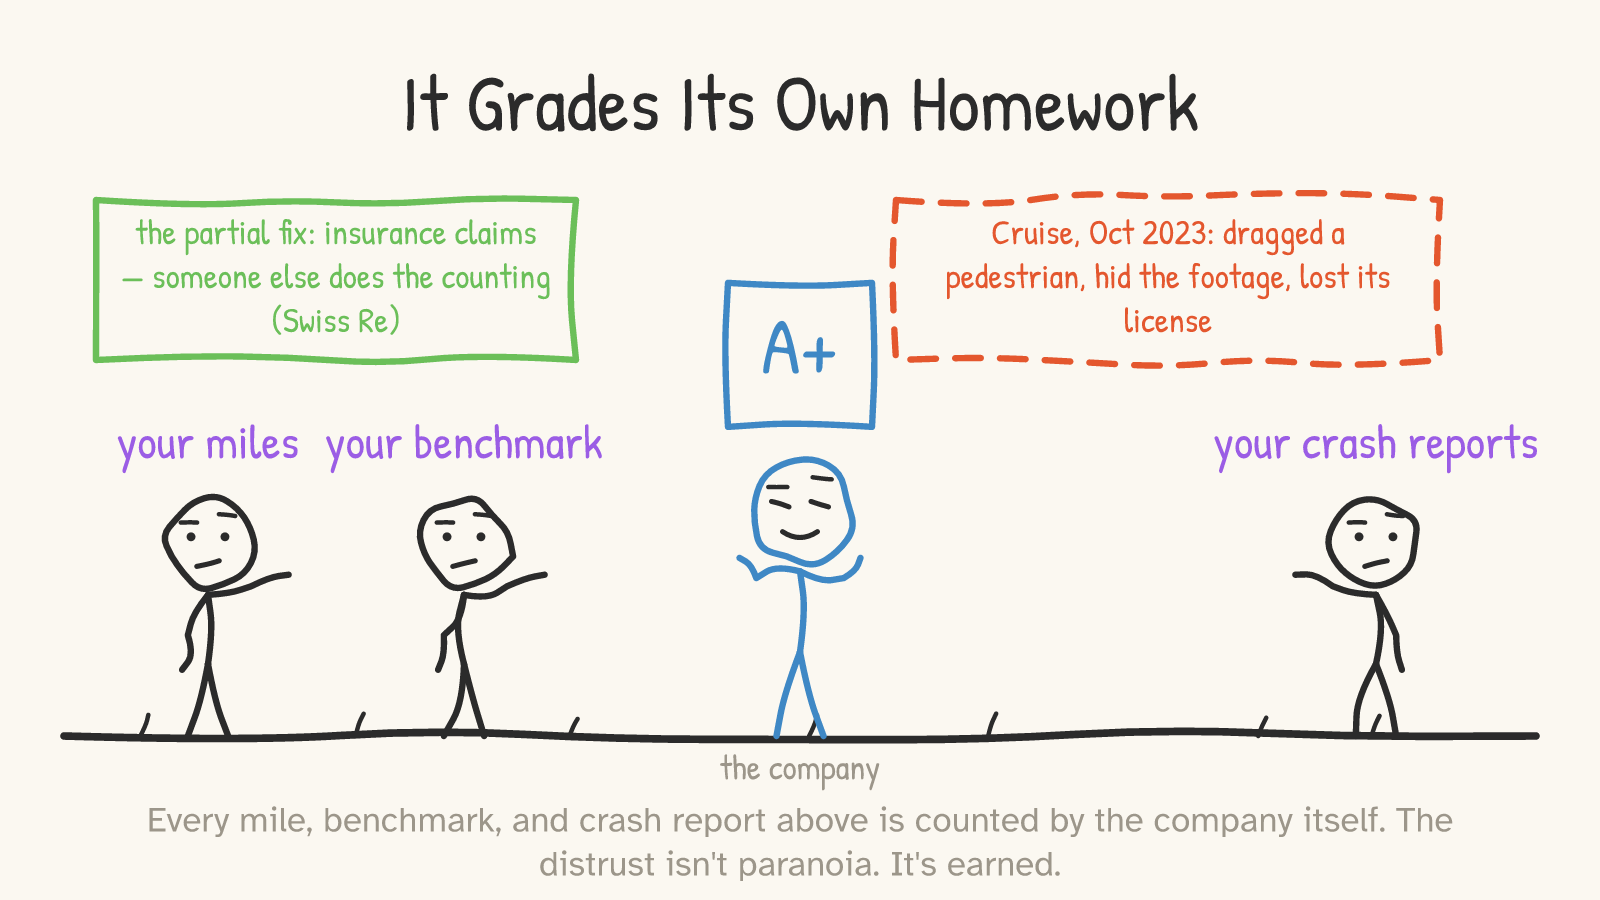
So when someone says they don't trust robotaxi companies' safety claims, do not tell them they're being irrational. They are being empirical. One of the two major operators earned every milligram of that distrust, and the surviving one publishes its safety case through its own marketing department.
Now the load-bearing paragraphs of the essay, so let's be exact. The strongest version of the skeptical case accuses no one of lying, because it doesn't need to. The numbers can be flattered without a single fabricated digit: operate on the easiest roads (that's the ODD selection), compare against a baseline that includes everyone else's hardest roads (that's the benchmark mismatch), and classify your own incidents (that's the pipeline). And note — because a careful skeptic will — that the journal paper, the Swiss Re analysis, and the federal filings all draw water from that same proprietary well. Three documents, one pipeline. That mechanism is real, requires zero bad faith, and is the actual reason no honest version of this essay can quote "80% fewer" as settled fact.
So don't quote it as settled fact. Stress-test it instead — and let's be honest about what these tests are, because nobody (including the companies; especially the companies) has published a decomposition of how much of the gap is road selection versus actual driving skill. That missing decomposition is part of the indictment. The discounts below aren't derived bounds; they're a way of asking how much flattery would the data have to contain before the conclusion changes? Take the weakest-guarded number, the ~79% injury-crash reduction, and halve it for the easy-roads effect: the robot still crashes about 40% less than the humans around it. Cut it by two-thirds: still about 26% less. The conclusion doesn't flip until the bias explains nearly everything — and the one comparison road mix has the hardest time explaining, Waymo against late-model, automatic-braking-equipped cars on the insurer's ledger, still shows about 90% fewer injury claims.8 Meanwhile the federal regulator that formally investigated Waymo's weird behaviors — the wrong-way moments, the bumped parked cars — forced two software recalls and closed the probe without finding an unresolved defect: scrutiny exists, and what it found was fixable bugs, not bodies.17
What systematic bias can't plausibly do is flip the sign. And note the bar for flipping it: not "worse than the drunk-inclusive average" — worse than every comparison on the table at once, including the one against late-model, safety-feature-loaded cars. The flattery would have to be manufacturing nearly the entire result, simultaneously, across three differently-shaped methodologies — a journal's crash rates, a reinsurer's claims, a federal docket — in the most-scrutinized vehicle deployment in history, under regulators who, as Cruise discovered, do eventually demand the full footage. Shade the numbers? Absolutely, assume it. Reverse them? That's no longer distrust; that's a conspiracy theory with a bibliography.
Part 4Headline math
If the evidence reads like that, why doesn't it feel like that?
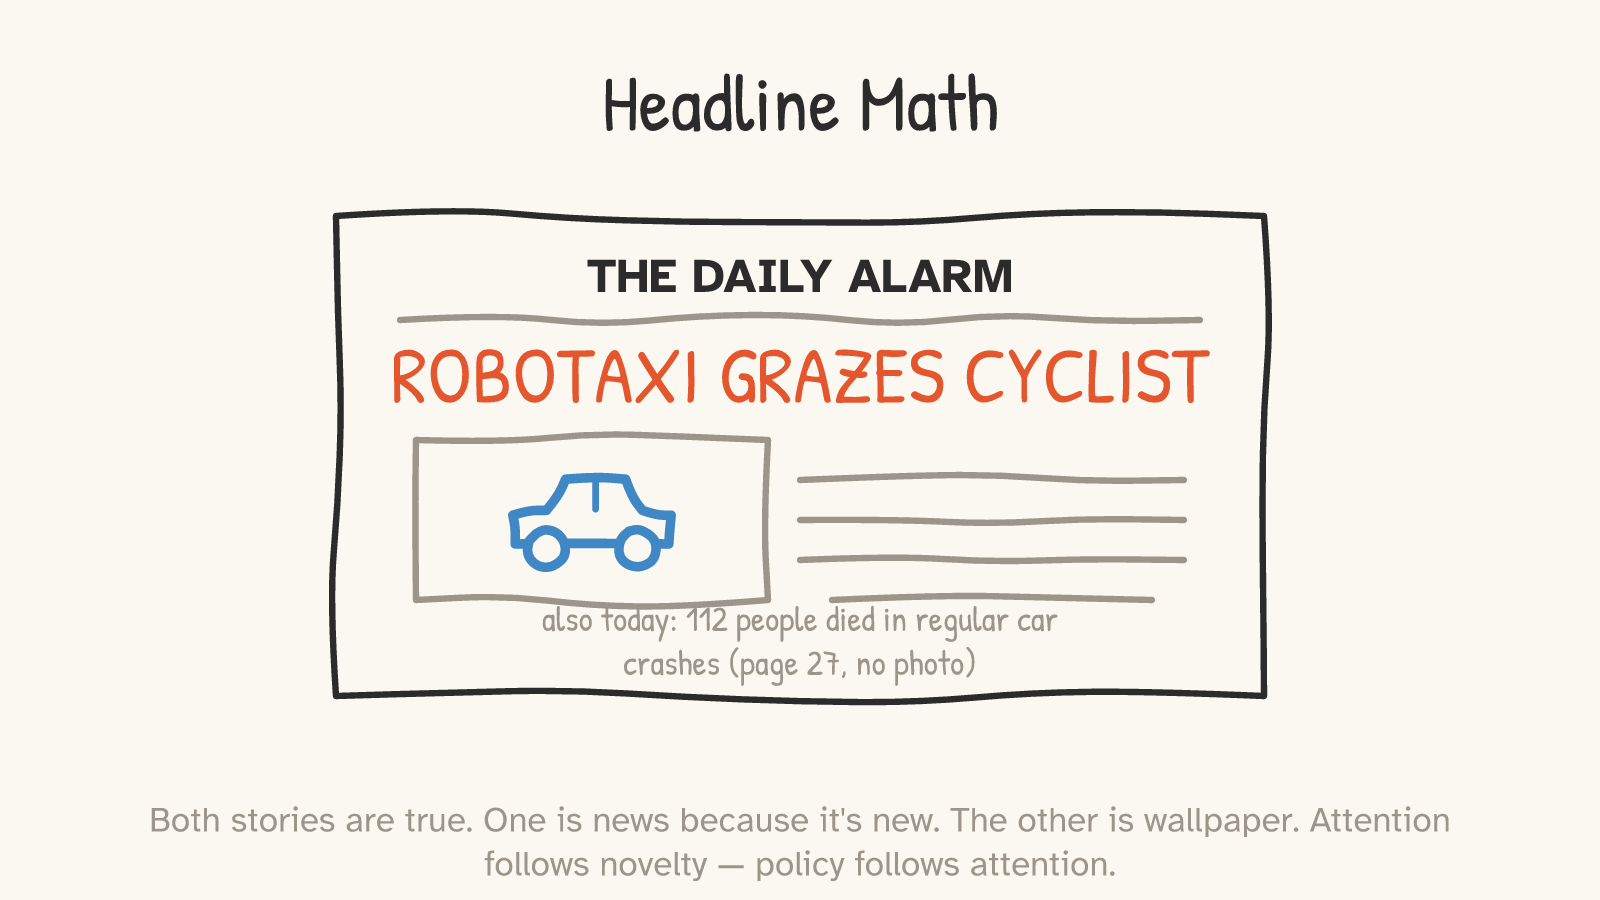
Because you have seen the robotaxi crashes. You saw the Cruise dragging — you should have; it was disqualifying. You saw the one stuck in wet concrete, the little fleet huddled and honking at 2 a.m., the clip of one hesitating in an intersection — each a real symptom of real system limitations the companies are still working through, and each one news precisely because it was new.
You have not seen the 112. There is no footage montage of Tuesday's ordinary deaths — the pickup that crossed a centerline outside Amarillo, the teenager who was texting, the grandfather who wasn't, all of them as dead as anyone a robot could kill. They didn't make the news because they are not new. They are the wallpaper of American life.
This is availability bias doing exactly what it was described to do, and it isn't a moral failing — it's how human attention works, yours and mine both. In AAA's surveys, six in ten American drivers say they're afraid of fully self-driving cars, and the fear spiked after the Cruise incident, exactly as you'd expect.18 Meanwhile, in the cities where the things actually operate, people keep getting in them by the millions of rides. That's not a gotcha — the riders are self-selected city dwellers, not a random sample of the fearful 61% — but it does mean the people with the most direct experience of the machine keep choosing it, which is at least as informative as stated fear of an experience the survey-taker hasn't had.
The asymmetry would be merely funny except that attention is the raw material of policy. Nobody holds a city council hearing about Tuesday. One viral robot clip can freeze a deployment across a state. Which brings us to the bar.
Part 5Two bars
This is the deepest objection, and the answer is not to wave it away: it's correct. A fleet-wide defect really is a different risk class than a million independent bad drivers. Algorithmic deaths really do scramble our accountability instincts — you can't jail a software stack, and "the company pays a fine" lands different than "the driver went to prison." A higher bar for machines is right.
The question nobody answering "higher bar" ever finishes is: how much higher, and who pays the difference?
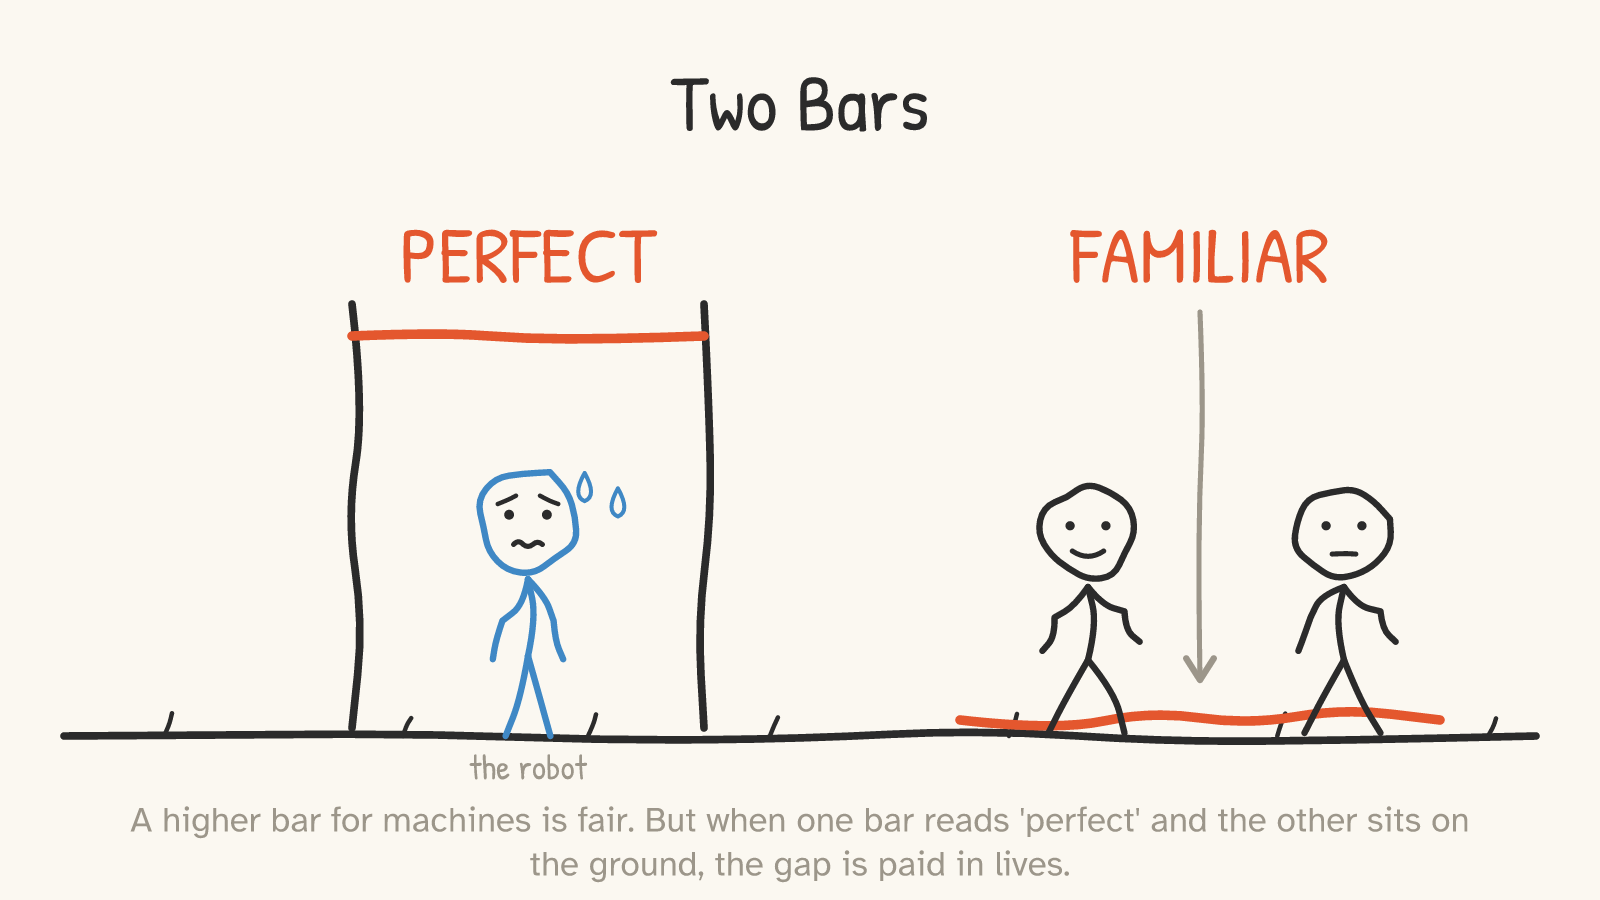
Because right now the two bars look like this: the robot's bar says perfect — one dragged pedestrian ended a company; one fatal software defect would plausibly end the industry. The human bar is lying on the ground: we re-license drunk drivers, the 112 don't make the paper, and the deadliest thing in most Americans' day is so familiar it's furniture. The gap between those two bars is not a moral statement. It's a death toll. Every year the demonstrably-safer-at-injuries system idles in regulatory limbo while we wait for it to be provably perfect, the familiar system keeps shipping its 40,000.
RAND modeled exactly this trade in 2017, and the result deserves to be more famous than it is. The question their model asks is precisely the two-bars question: should the deployment threshold be "modestly better than humans" (they test ~10% better) or "nearly perfect" (75–90% better)? Across their scenarios, the lower bar saves more lives — cumulatively as many as half a million in the US over roughly twenty to thirty years of fleet turnover. A model, not a prophecy: the count depends on adoption-speed assumptions, it varies improvement trajectories rather than modeling a robotaxi-induced explosion in total miles driven (more on that in Part 7), and "up to" is doing real work in that sentence. But the direction is robust across the scenarios they model, and the direction is the point: waiting for perfect is paid for in the currency of people killed by the familiar.19
That's the steelman's own logic, completed. Yes — hold the machine to a higher bar. Audit it, regulate it, recall it, fine it, suspend it when it lies. But "higher" cannot mean "perfect, or banned," because the thing it's replacing is so far from perfect that the gap between the bars is measured in funerals per week.
Part 6The man with the red flag
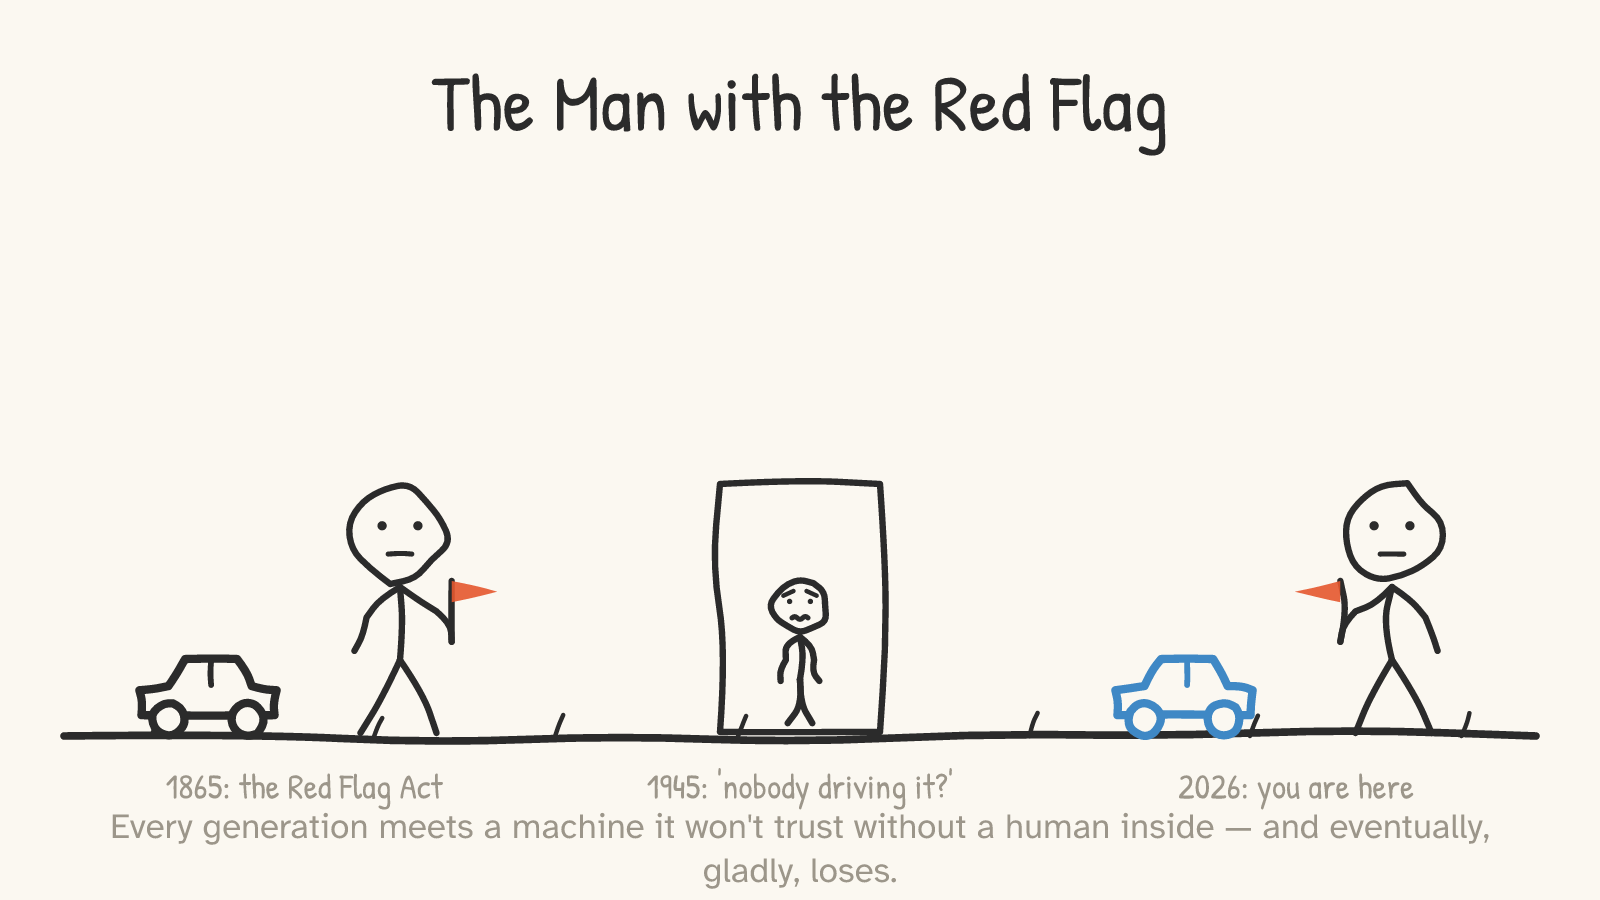
In 1865, the British Parliament required every self-propelled road vehicle to be preceded — on foot — by a man carrying a red flag, at walking pace, by law. The Red Flag Act stood for thirty-one years and is widely — if not universally — credited by historians with helping hand the early automobile industry to France and Germany.20 The fear wasn't stupid: those machines were genuinely dangerous. The law was stupid: it pinned a transformative technology to the speed of the thing it improved on, to soothe a fear that was aimed at the new danger and blind to the old one.
In 1945, New York City's elevator operators went on strike, and the city discovered that the automatic elevator — which had existed for years — was suddenly worth installing, because the public's "you want me to get in a box with nobody driving it?" terror turned out to be softer than the inconvenience of climbing forty floors. Within a decade, nobody remembered being afraid.21 (An elevator is a far simpler machine than a car in traffic — the analogy is about the fear, not the engineering: the fear was sincere, specific, universal, and gone the moment familiarity arrived.)
And when the machines were genuinely imperfect, the arithmetic still held. Seatbelts were resisted for a decade and a half — it took until 1984 for the first state to mandate wearing the belts that had been required equipment since 1968; federal modeling credits them with over 300,000 lives since.22 Early airbags killed more than 290 people in low-speed crashes — disproportionately children — nearly all in vehicles built before the 1998 redesign, with deaths in old-design cars trailing on for years after the fix; a real body count, honestly counted by the same agency that mandated them. They have saved more than 50,000 lives anyway.23 That ratio, horror included, is what an imperfect safety technology deployed before perfection looks like in hindsight: like one of the best decisions we ever made.
The man with the red flag wasn't a villain. He was a reasonable response to a new danger, walking ahead of the machine that would eventually cut the old danger down. The only thing wrong with him was the direction he was facing.
Part 7What being for fewer deaths looks like
Last objection, and once more the concession comes first: the boring stuff works. Centerline rumble strips cut lane-departure fatal crashes by about half for a few thousand dollars a mile.24 A bus is roughly ten times safer per passenger-mile than a car.25 Oslo and Helsinki redesigned their streets and each put up a year with zero pedestrian deaths.26 If the choice were "robotaxis or proven road engineering," road engineering would win.
But notice that nobody proposing the trade can produce the mechanism by which it's a trade. The dollars are different dollars — Waymo's capex was never going to become a bus lane. The bottleneck on road diets is not robotaxi hype; it's the same status-quo reflex this whole essay is about, the one that packs a council meeting to save street parking. A movement that can't pass a speed camera was not one robotaxi ban away from Vision Zero. These are two fronts of the same war against the familiar death toll — and the city that takes safety seriously fights on both.
And three more objections deserve naming precisely because this essay can't settle them, only locate them.27 Labor: a few million Americans drive for a living, and robotaxis are aimed at their paychecks — that's a real harm to real people, it just isn't a safety argument, and the honest response is transition policy funded by the technology's winners (San Francisco already taxes AV rides for transit), not a ban that keeps the death toll as a jobs program. Induced demand: make rides cheaper and people take more of them, so total miles rise even as per-mile risk falls — if robotaxis someday add enormous mileage, that eats into the net safety gain, and the RAND-style models assume it doesn't explode. Worth watching honestly; note that it's an argument about how much safer deployment makes us, not whether. Fleet-scale failure: a hacked or buggy update ships to every car at once in a way no drunk driver can — a genuine new risk class, and here's the uncomfortable part: the governance for it mostly doesn't exist yet (the UN's vehicle-cybersecurity and software-update rules don't bind the US market, and AV STEP is still a proposal). So the honest framing of the pro-deployment position is a trade: a large, measured, per-mile reduction in ordinary crashes, in exchange for a small, unquantified tail risk of correlated failure — taken on while we build the security standards and audited update pipelines that should have been deployment conditions in the first place. That's a values judgment, not pure arithmetic, and pretending otherwise would be the same sin as the 94% stat. What it isn't, is a reason to prefer the certain 40,000 to the uncertain tail.
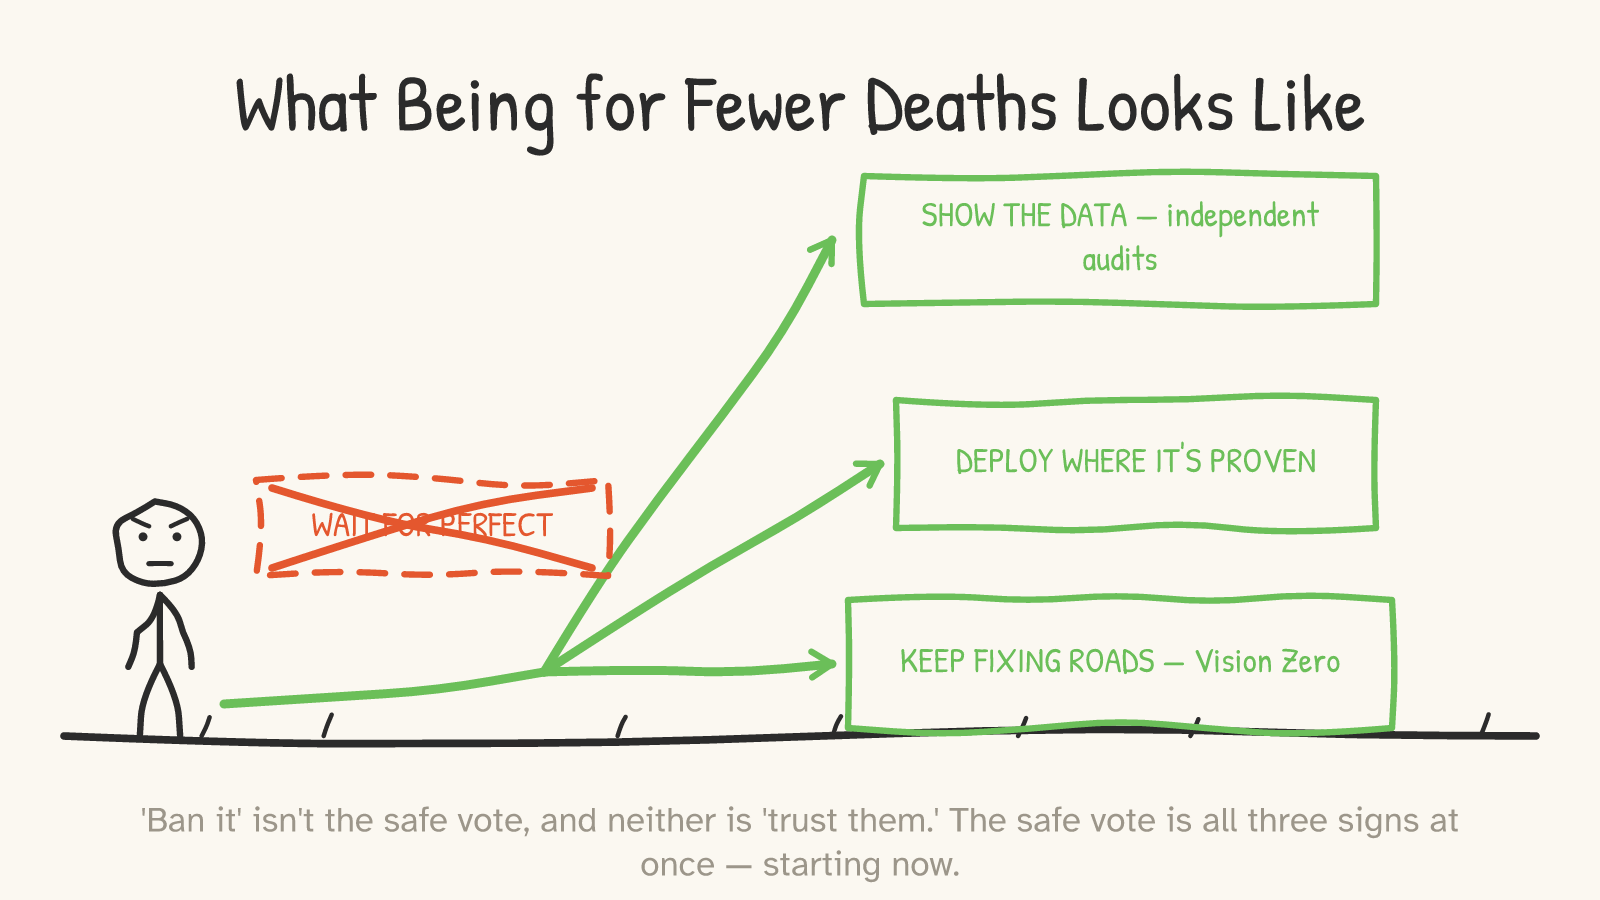
So here is what the genuinely pro-safety position looks like, all three signs at once:
Show the data. Mandatory, standardized, independently audited safety reporting as a condition of deployment — the federal AV STEP proposal with actual teeth, raw fleet data accessible to qualified researchers, benchmarks set by regulators instead of marketing departments.28 The companies that are telling the truth lose nothing but the benefit of the doubt they keep setting on fire.
Deploy where it's proven. Where the evidence holds — dense, mapped, urban service areas, the places currently killing seven thousand pedestrians a year — expansion is not recklessness. Holding it back there isn't caution; it's choosing the wallpaper deaths.
Keep fixing the roads. Rumble strips, road diets, transit, speed cameras, all of it. The robot is not an alternative to Vision Zero. It's the first new recruit Vision Zero has had in decades.
One more pass at the core of it, because it's the whole essay in four sentences: The status quo kills a planeload of Americans every thirty-six hours, and we have stopped seeing it. The replacement, on every measure we can actually count — discounted for every legitimate criticism of who's doing the counting — crashes dramatically less. We are holding the replacement to a standard of perfection while holding the incumbent to a standard of familiarity. People who say they oppose self-driving cars out of caution have the right instinct pointed at the wrong machine — the cautious position is the one that counts all the bodies, including the 112 the robot didn't kill today.
Be against corporate opacity. Be against self-graded homework. Be loudly, permanently against companies that hide footage. But "against self-driving" as a position? Run the headline math. That's not being against the robot. That's being for the plane.
Footnotes & receipts
- NHTSA, Traffic Safety Facts / FARS final counts: 40,901 US traffic deaths in 2023 (1.26 per 100M VMT); 42,514 in 2022; 42,939 in 2021; ~39,345 estimated for 2024. Injuries 2023: ~2.44 million. Government data; 2024 figure is an early estimate subject to revision. 40,901/365 ≈ 112/day; at 172 seats (a typical 737 MAX 8 configuration), one full plane per ~1.5 days. ↩
- WHO, Global Status Report on Road Safety 2023: ~1.19 million road deaths/year globally. Country-reported data of variable quality; ≈3,260/day. ↩
- NHTSA 2023 alcohol-impaired-driving fatalities: 12,429 (30%), defined as any involved driver at BAC ≥ 0.08. Involvement, not sole causation; BAC sometimes imputed. ↩
- NHTSA Traffic Safety Facts, Speeding (2023): 11,775 deaths (29%) coded speeding-related — police-coded, includes "too fast for conditions," known to undercount. ↩
- NHTSA distracted driving 2023: 3,275 deaths in crashes with a coded distracted driver; NHTSA and naturalistic-driving research note police coding substantially undercounts (phone-record studies put true involvement at a multiple of the coded rate). Drowsy driving: ~1.6–1.8% coded; NHTSA's own countermeasures literature estimates the true rate many times higher. ↩
- NHTSA, National Motor Vehicle Crash Causation Survey (2008; 2005–07 sample): driver assigned as "critical reason" — the last event in the causal chain, explicitly not sole cause — in 94% ± 2.2% of sampled crashes. NHTSA's accompanying text warns against the "94% of crashes are caused by human error" reading this stat almost always gets. ↩
- Kusano et al., "Comparison of Waymo Rider-Only Crash Data to Human Benchmarks at 7.1 Million Miles," Traffic Injury Prevention (2024), PubMed 39485678. Peer-reviewed; co-authored by Waymo researchers (disclosed conflict); benchmarks literature-derived for Waymo's operating counties, not trip-matched. 0.60 vs 2.80 injury-causing crashes per million miles (−79%); 2.10 vs 4.68 police-reported (−55%); zero airbag-deployment crashes in the study window. ↩
- Waymo & Swiss Re, "Do Autonomous Vehicles Outperform Latest-Generation Human-Driven Vehicles?" (December 2024): across 25.3M driverless miles, 2 bodily-injury claims vs 26 expected (−92%) and 9 property-damage claims vs 78 expected (−88%); vs late-model ADAS-equipped vehicles only, −90% BI and −86% PD. Baseline: Swiss Re data, 500,000+ claims over 200B+ miles of exposure, geographically aligned (Phoenix, SF, LA, Austin). Co-published by Waymo with Swiss Re, not independently by Swiss Re — the most independent-ish count available, not an audit; the geographic alignment of the human baseline to Waymo's operating areas follows the study's own methodology and has not been independently replicated. An earlier 3.8M-mile version (2023) showed zero BI claims. ↩
- Waymo (company blog, July 2025): 100 million rider-only miles. Self-reported; no independent odometer audit exists. ↩
- As of mid-2026, no fatal crash has been documented in which a Waymo vehicle was determined to have caused the death (NHTSA Standing General Order filings + media review). The January 19, 2025 San Francisco fatal: a human-driven car at ~98 mph rear-ended a stopped Waymo at 6th & Harrison, triggering a multi-vehicle collision that killed one man (and his dog) and injured several others; the human driver was detained on vehicular-manslaughter charges, and first responders did not fault the Waymo. Fault framing here follows contemporaneous reporting (KRON4; legal-industry summaries), not a final court determination. ↩
- NTSB Report HWY18MH010 (Tempe, AZ, March 2018): Uber ATG test vehicle struck and killed Elaine Herzberg. Probable cause spans the ADS design (detected but misclassified her; automated emergency braking disabled by design), the safety driver's video-watching, and Uber's safety culture. The safety driver pleaded guilty to endangerment (2023). ↩
- Washington Post analysis (June 2023) of NHTSA Standing General Order data through 2022: 736 crashes, 17 fatalities with Tesla Autopilot reported active. "Active" ≠ "caused"; SGO is manufacturer-self-reported with known inconsistencies. SAE Level 2 (driver responsible) — categorically distinct from Level 4 driverless operation; Tesla's 2025 Austin "robotaxi" pilot ran supervised FSD, i.e., L2. ↩
- Benchmark-matching limits per Kusano et al. and its critics (Koopman, CMU; Cummings, GWU): same-county human rates are the strongest available control but not trip-matched; ODD selection (weather, road types) remains the chief residual confound. No independent academic replication of any robotaxi fleet's data existed as of mid-2026. ↩
- NHTSA pedestrian fatalities: 5,376 (2015) → 7,522 (2022 peak) → 7,314 (2023). Cyclists 2023: 1,166. ↩
- Kalra & Paddock, "Driving to Safety" (RAND RR-1478, 2016), keyed to the 2013 human rate of 1.09 fatalities/100M VMT: 275 million fatality-free miles to demonstrate with 95% confidence that an AV fleet's fatality rate is no worse than humans'; demonstrating a 20% improvement requires on the order of billions of miles (the paper's headline example: ~8.8B). Injury-level rates need far fewer miles — which is why this essay's claims rest on injury and claims data. The paper argues for alternative validation methods, not against deployment. ↩
- Cruise timeline: incident Oct 2, 2023 (San Francisco); CA DMV permit suspension Oct 24, 2023, citing lack of candor over withheld footage; NHTSA consent order with $1.5M penalty (Sept 2024); GM wind-down announced Dec 2024 after ~$10B invested. CPUC proceedings additionally; Cruise disputed intentional concealment, regulators found the explanation insufficient. ↩
- NHTSA ODI PE24016 (Waymo): opened May 2024 after reports of erratic behaviors; 367 incidents reviewed (109 crashes, 1 minor injury); two software recalls (June 2024, May 2025); closed mid-2025 with no unresolved safety defect. ↩
- AAA annual surveys (~1,000 US adults, online panel): 68% "afraid" of fully self-driving vehicles (Mar 2023), 66% (Mar 2024), 61% afraid + 26% unsure (Feb 2025); AAA's 2024 release cites high-profile AV incidents. Survey asks about hypothetical full self-driving; stated-preference instrument. ↩
- Groves & Kalra, "The Enemy of Good" (RAND RR-2150, 2017): deploying highly automated vehicles at ~10% better than human drivers, vs waiting for 75–90% better, saves up to ~500,000 cumulative US lives over roughly 20–30 years of fleet evolution in their model. Modeled estimate, sensitive to adoption-speed assumptions; cumulative, not annual. ↩
- UK Locomotive Act 1865 ("Red Flag Act"): ≤2 mph in towns, pedestrian with red flag preceding; repealed by the Light Locomotives on Highways Act 1896. Historians' standard account of its effect on the early British auto industry. ↩
- 1945 NYC elevator operators' strike (~15,000 strikers) as the inflection point for automatic-elevator adoption; public fear of operatorless elevators dissolved within roughly a decade. Historical accounts; used here as analogy, not data. ↩
- FMVSS 208 required belts from 1968; New York passed the first US mandatory-use law in 1984; NHTSA counterfactual modeling credits seatbelts with 329,715 lives saved 1960–2012 (higher through present). Modeled estimate. ↩
- NHTSA: frontal airbags credited with >50,000 lives saved over ~30 years. NHTSA's Special Crash Investigations counted 290+ deaths caused by airbag inflation in low-speed crashes 1990–2008, ~90% in pre-1998 vehicles, with children a large share (e.g., 31 of 53 airbag-deployment deaths in 1997); post-redesign, the child/infant SCI fatality rate fell ~93%. Both sides of the ledger are NHTSA's own counts. ↩
- FHWA/NCHRP safety literature: centerline rumble strips reduce lane-departure fatal crashes ~45–50% at installation costs frequently under $5,000/mile. ↩
- Bureau of Transportation Statistics: bus travel ≈ 10× lower fatality rate per passenger-mile than passenger-car travel. ↩
- Oslo and Helsinki each recorded zero pedestrian traffic deaths in 2019 following systematic speed-limit and street-design programs (city DOT data via press). Small cities; the multi-year near-zero trend is the meaningful signal. NYC Vision Zero: ~250 (2014) → ~120 (2020), partly COVID-depressed; pre-COVID trend ≈ −20–30%. ↩
- The labor, induced-demand, and fleet-scale-failure objections in brief: BLS counts several million Americans in driving occupations broadly (taxi/rideshare/delivery/heavy truck); induced demand is standard transport economics (lower price per ride → more rides → more VMT) and is an assumption-level input to deployment models like RAND RR-2150 rather than an output; fleet-wide software/cybersecurity risk is the system-level hazard class that distinguishes ADS from passive safety tech (demonstrated in principle by the automotive-hacking literature since Miller & Valasek, 2015), and is the strongest argument for mandatory security/update standards as deployment conditions. None of the three is a per-mile safety counterargument; all three are real policy work. ↩
- NHTSA AV STEP proposal (Dec 2024): voluntary national framework for ADS safety-data transparency with third-party review; still un-enacted as of mid-2026. No comprehensive federal AV statute passed 2024–2026. SF's Prop L (Nov 2024) taxes AV ride-hail to fund transit — restriction by economics, not prohibition. ↩