Here is a thing that is true and that this essay will not, at any point, pretend is not true: if a letter arrived tomorrow saying your rent was going up 18%, and the November ballot offered to make that illegal, you would vote yes. So would I. Rent is the largest number in most renters' months, it buys the place where your kid sleeps, and you do not set it — someone else does, and the law in most of America lets them raise it as far as the market will bear, which lately has felt like exactly as far as you can bear.
So when a city votes on capping rent — and they keep voting on it: a US president proposed a national cap in 2024, California has voted on expanding rent control three times in six years, New York's current mayor ran on freezing a million stabilized rents1 — nobody needs the case for explained to them. The case for is the envelope. The case for is the scariest piece of mail you get all year.
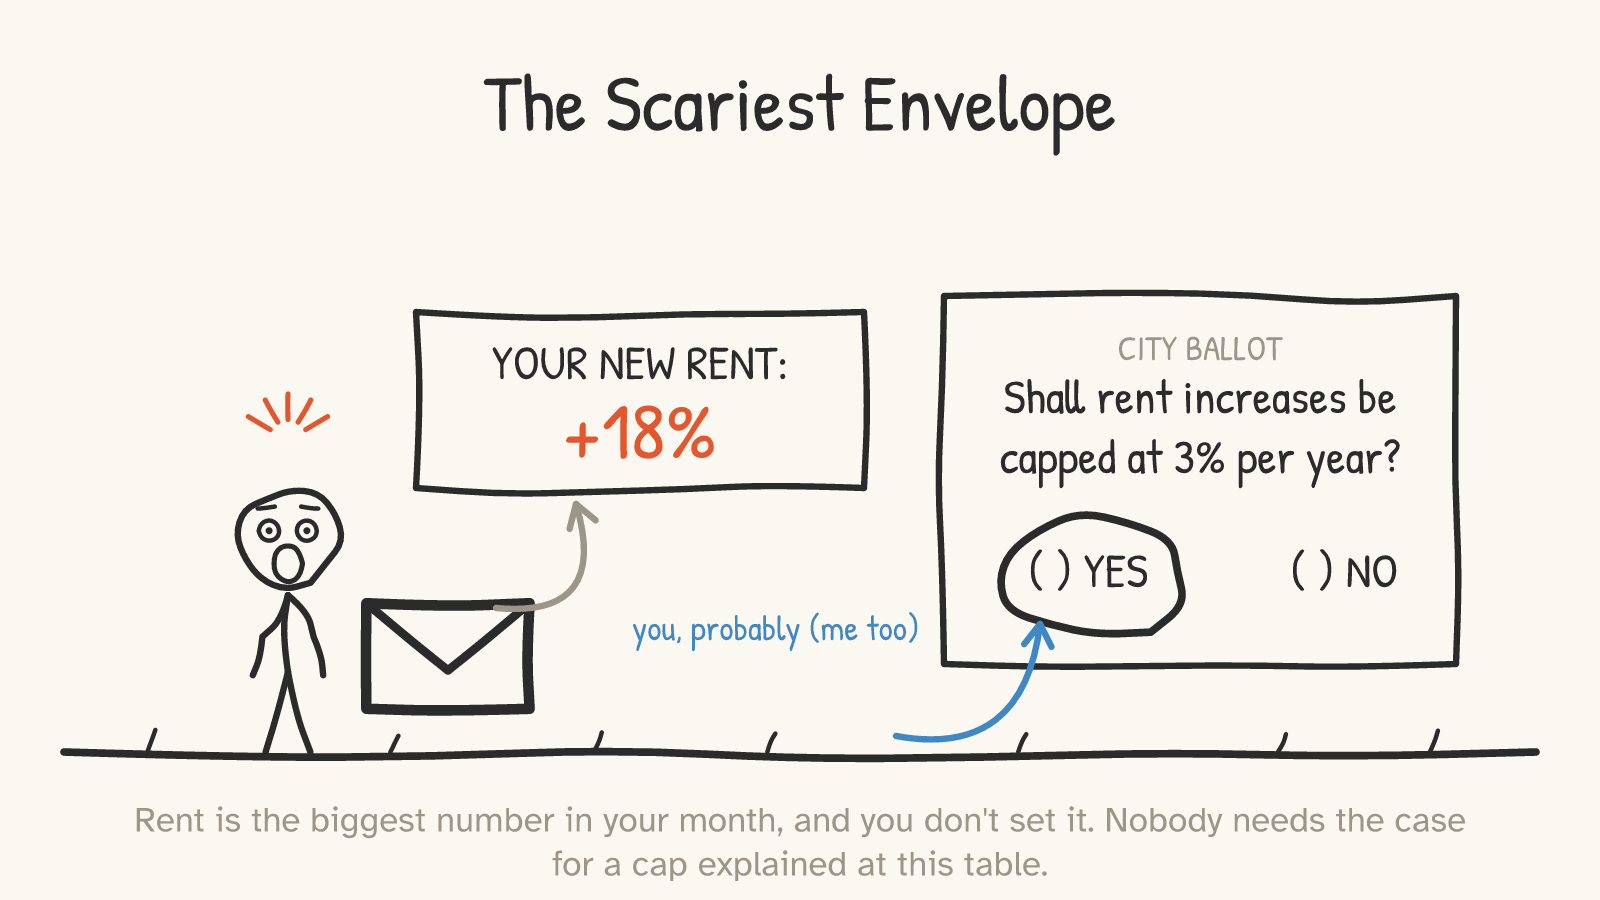
This essay is about why that vote — cast for the most understandable reasons in the world, by people who are right about the problem — keeps producing cities with less housing, higher rents for everyone not already settled, and a line at the door you measure in years. Not because economists are clever and voters are dumb. Because of one fact about apartments that the ballot language never mentions:
They can leave.
Part 1The apartments can leave
The intuition behind a rent cap runs like this: the apartment exists, the landlord is greedy, a law caps the greed, the apartment still exists, and now it's cheaper. The building is just standing there. What's it going to do — walk away?
Sort of, yes.
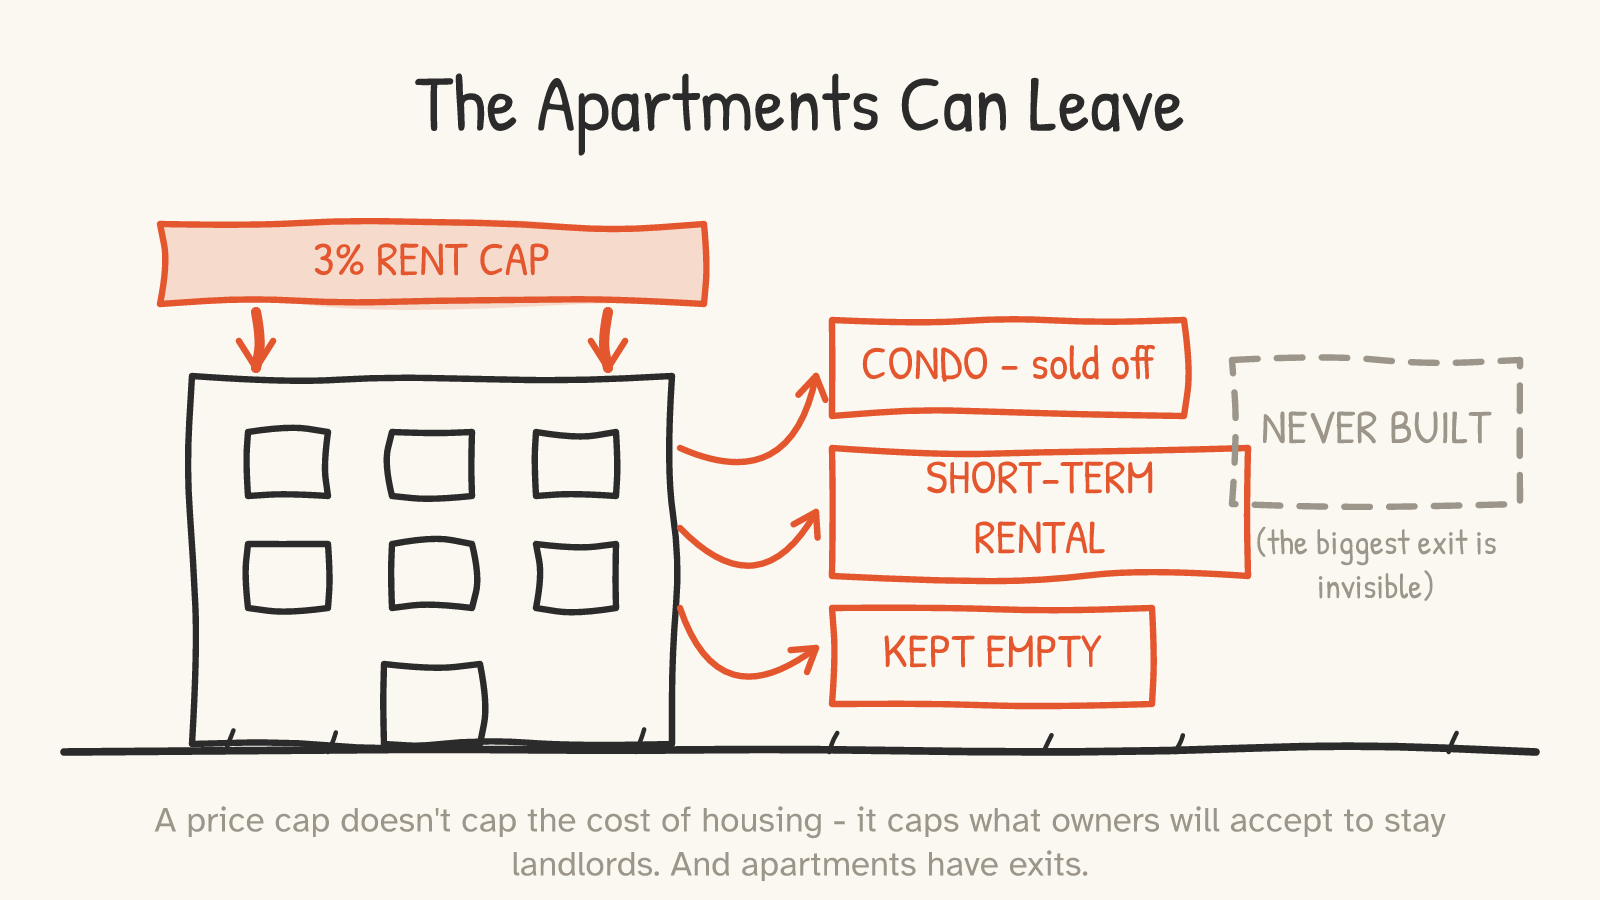
A rental apartment isn't a fact of geology; it's a deal that gets re-decided every year, by someone who has other options. Cap what the apartment can earn as a rental, and it doesn't vanish — it converts. It becomes a condo and gets sold. It becomes a short-term rental. It becomes the owner's own residence, or their cousin's. In the strange limit case it just sits empty, because a tenant you can never re-price (and in some regimes can never ask to leave) is a liability someone may decline to take on. And the most important apartment of all — the one that responds fastest and hurts longest — is the one that never gets built, because the people who finance new buildings read ballot results too.
None of this requires cartoon villainy. It requires only that the people who own and build housing respond to a price cap the way you respond to prices every day of your life: by doing less of the thing that pays less. Economists have been writing this exact prediction down since Milton Friedman and George Stigler watched San Francisco's postwar rent control produce a city of hoarded space and vanished listings in 1946.2 For decades you could dismiss that as theory with a political accent.
Then the experiments got run.
Part 2The experiment was run
"Okay," says the fair-minded skeptic, "that's a supply-and-demand diagram wearing a trench coat. Housing is weird. Show me what actually happens."
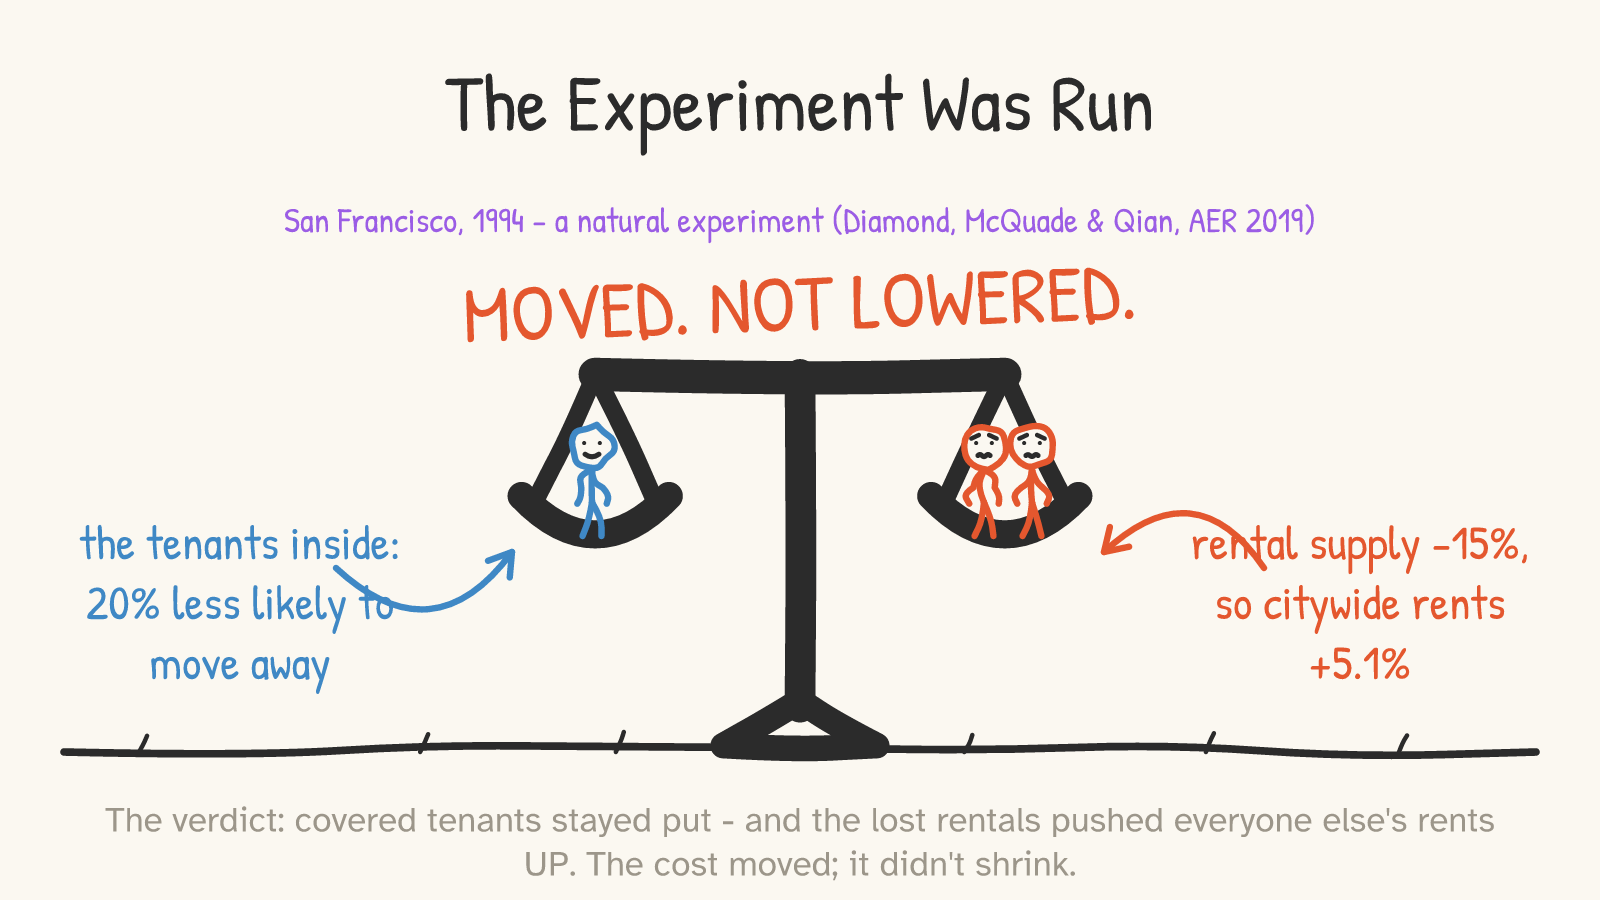
In 1994, San Francisco accidentally built the cleanest rent-control experiment ever conducted. A ballot measure extended rent control to small buildings (four units or fewer) constructed before 1980 — buildings that had been exempt — while otherwise-identical small buildings built just after 1980 stayed uncovered. Two populations of nearly indistinguishable buildings and tenants; one law lands on half of them. A quarter-century later, three Stanford economists — Rebecca Diamond, Tim McQuade, and Franklin Qian — traced what happened to every one of them, in what has become one of the most influential empirical studies of rent control ever conducted.3
Two findings, and you need both.
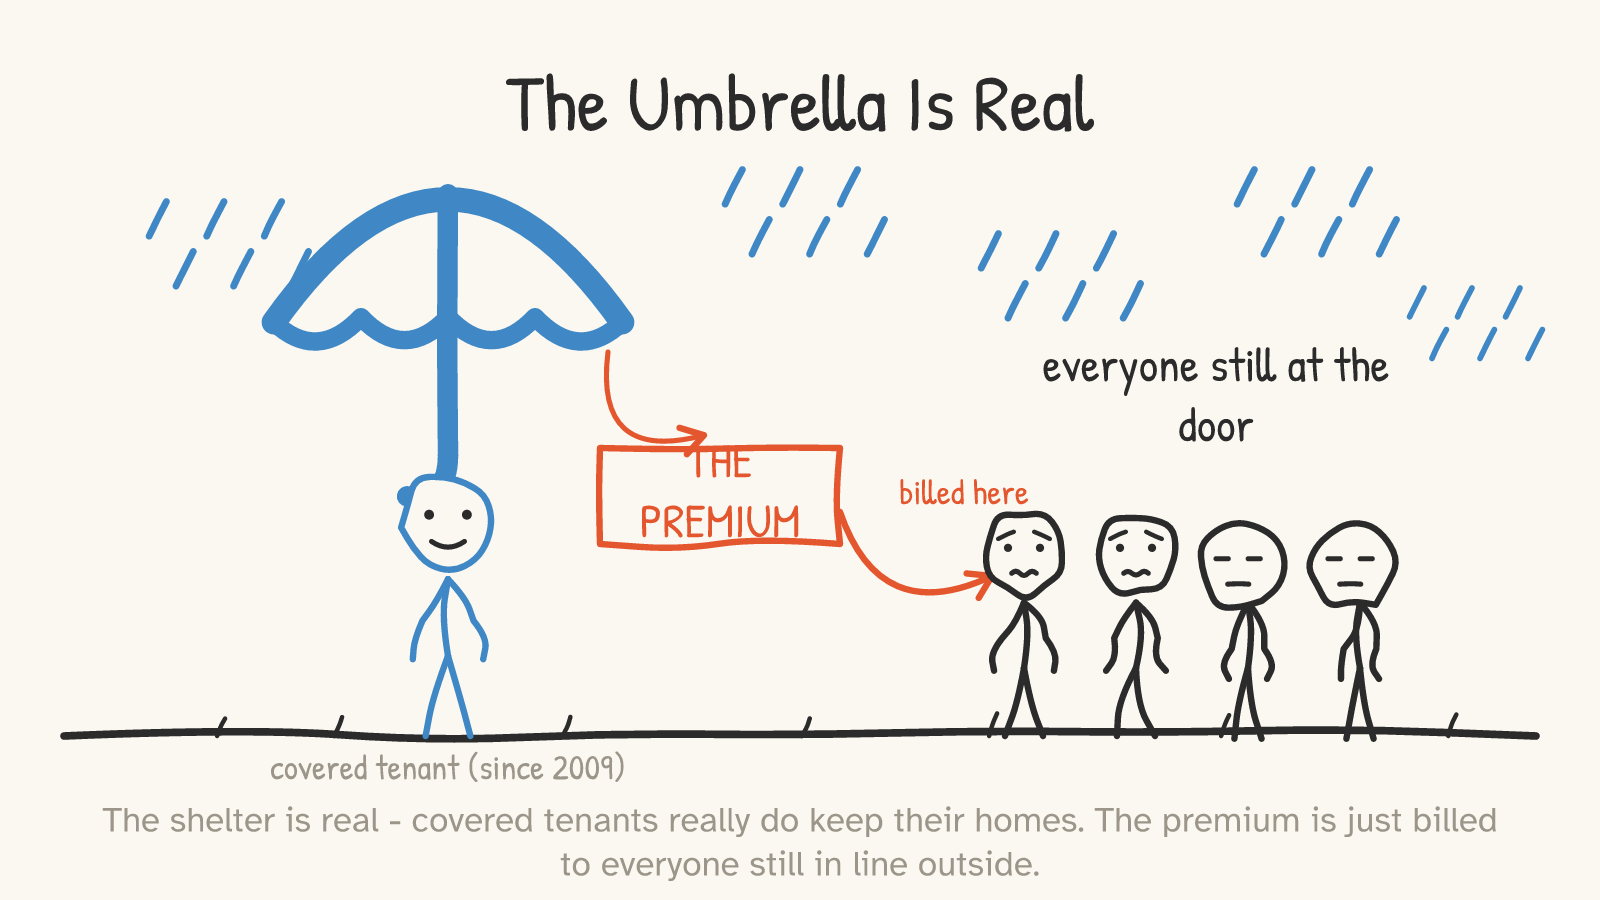
The policy worked, exactly as promised, for the people inside. Tenants in newly covered buildings became dramatically more likely to stay put — the paper measures rent control reducing covered tenants' moving-away rate by about 20%, with the biggest gains for older, longer-tenured households. Real people kept homes they would have lost. Hold that; it's load-bearing, and we're coming back to it in Part 5.
And the policy shrank the city's rental housing. Landlords of covered buildings cut the supply of rental housing by about 15% — selling units off as condos and owner-occupied homes, or redeveloping into exempt new construction. The rental homes that exited were replaced by housing that served richer people, and the lost rental supply, the authors estimate, pushed rents across the whole city up by about 5.1%. Their conclusion, in their own words: the lost supply "likely increased rents in the long run, ultimately undermining the goals of the law."3
Look at what that adds up to. The covered tenants' savings didn't come out of landlords' pockets in the end — landlords exited, converted, repriced. The savings were paid by other renters: the newcomers, the young, the not-yet-arrived, paying 5.1% more across the uncovered city. The cap didn't lower the cost of housing in San Francisco. It moved the cost — from the people inside the walls to the people at the door.
This is also roughly the verdict of the entire empirical literature, which is unusually unanimous by economics standards. When the IGM panel of prominent academic economists — a deliberately ideologically mixed group — was asked whether rent control ordinances like New York's and San Francisco's — America's strictest, oldest variants, to be scope-honest — had had a positive impact on the amount and quality of affordable rental housing, 2% agreed and 81% disagreed.4 Surveys of the research literature going back decades find the same recurring quartet: controlled rents down, uncontrolled rents up, supply down, maintenance down.5 Assar Lindbeck — a Swedish social democrat, not a Chicago libertarian — writing about his own country's rent-controlled housing market, produced the line economists have been quoting for fifty years: "In many cases rent control appears to be the most efficient technique presently known to destroy a city — except for bombing."6
But "rents up for everyone else" is only half of what a cap costs. The other half is stranger, because it isn't paid in money at all.
Part 3The cost changes currency
Suppose the cap holds. Suppose conversion is banned, enforcement is perfect, and a controlled apartment really does rent for half the market price, forever. The skeptic leans in: "Then the tenants win, full stop, right?"
Then a different question takes over: who gets it? The price was doing a job — deciding, however bluntly, whose need ran hottest. Outlaw the price and the job doesn't disappear. It gets done by something else.
In Stockholm, it's done by a line.
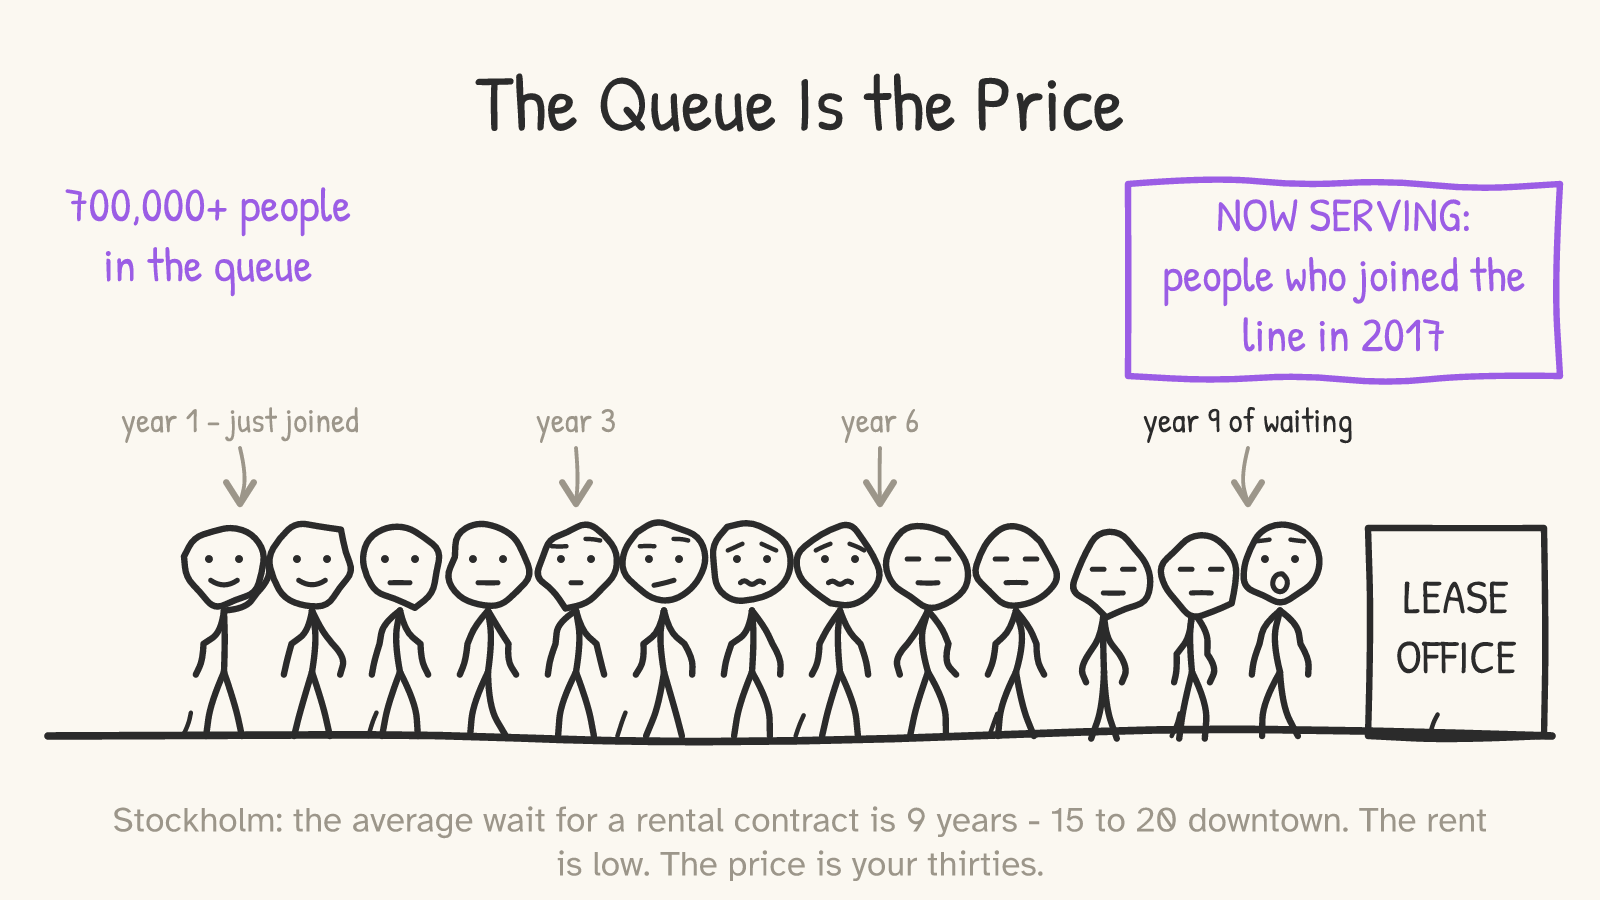
Sweden has capped rents below market since 1942 — set citywide by negotiation, allocated through an official municipal queue. The queue currently holds over 700,000 people, in a city of under a million — and yes, that number includes suburbanites and the many Swedish parents who enroll their teenagers as a hedge, a practice which is less a caveat than a diagnosis. The average wait for a rental contract is about nine years; for the inner city, fifteen to twenty.7 The student-housing line averages four and a half years, which is longer than a degree. And the queue has a demography — per a KTH Royal Institute analysis of the queue's own administrative records: in 2003, people under 30 got about 13% of Stockholm's new rental contracts; by 2023, 4%. The over-60s' share more than quadrupled.8 The line doesn't ration by need. It rations by when you joined the line — which is to say, by already having been comfortable enough, long enough, to wait.
And waiting is just the most visible currency. The cost of a binding cap gets paid in whatever the law forgot to ban: key money slipped under Stockholm tables for first-hand contracts; the "misallocation" economists Ed Glaeser and Erzo Luttmer documented in New York, where rent regulation shuffles apartments so badly relative to who-needs-what that empty-nesters hold family-sized units while families stack up in studios — a welfare loss they estimated in the hundreds of millions to billions per year, before anyone counts a dollar of forgone construction.9 It gets paid in immobility — Danish data shows tenants in the most-regulated units stay roughly six years longer than comparable tenants in the least-regulated ones, glued in place by a deal too good to surrender even when the job, the school, or the family says move.10 And it gets paid in decay: a landlord who can't raise the rent fixes the boiler slower, and the data has said so since researchers started checking New York's controlled stock in the 1980s.11
Money, time, luck, connections, paint. The cost is conserved. Only the currency changes.
Part 4The speedruns
"Those are old, extreme cases," says the skeptic, reasonably. "Nobody's proposing 1942. Show me this happening now, with modern designs."
The 2020s obliged, three times, fast.
Berlin, 2020. The city froze rents at June 2019 levels for everything built before 2014 — new construction carefully exempted, just like the modern playbook says. Covered rents duly fell about 11%. Also: the supply of apartments listed for rent collapsed by more than half, as owners sold into the owner-occupier market, held units back, or shifted to the exempt segment — where rents promptly rose about 12%. Germany's constitutional court voided the law after fourteen months — and here's the detail worth sitting with: listings didn't bounce back. A year after the ruling, the ifo Institute found Berlin's rental listings still far below their pre-cap level.12 Why no Argentine-style flood? One candidate explanation — unprovable but hard to ignore — is that the cap died on a constitutional technicality while the politics that produced it stood fully armed, and owners price the next law, not the last one. Others are more mundane: units already mid-conversion don't convert back overnight. The ifo data documents the non-recovery without settling the mechanism; either way, a cap that lasted fourteen months cast a shadow measured in years.
St. Paul, 2021. Voters passed the strictest big-city rent control in modern US history — 3% annual cap, no exemption for new construction, no reset between tenants. In the five months after the vote, permits for new multifamily homes fell from 1,895 (same window, prior year) to 248 — a collapse of more than 80% — while permits rose next door in Minneapolis. (Honesty note: Minneapolis had just passed a famous pro-housing rezoning, so it's an imperfect control group — but nothing about that explains a more-than-seven-fold drop on the St. Paul side of the river.) A working paper put the hit to covered property values at roughly 4–6%.13 Within fourteen months the city council retreated and exempted new construction for twenty years. The developers' lesson was already taught: the cap that matters isn't the one in the ordinance, it's the one the next referendum might pass.
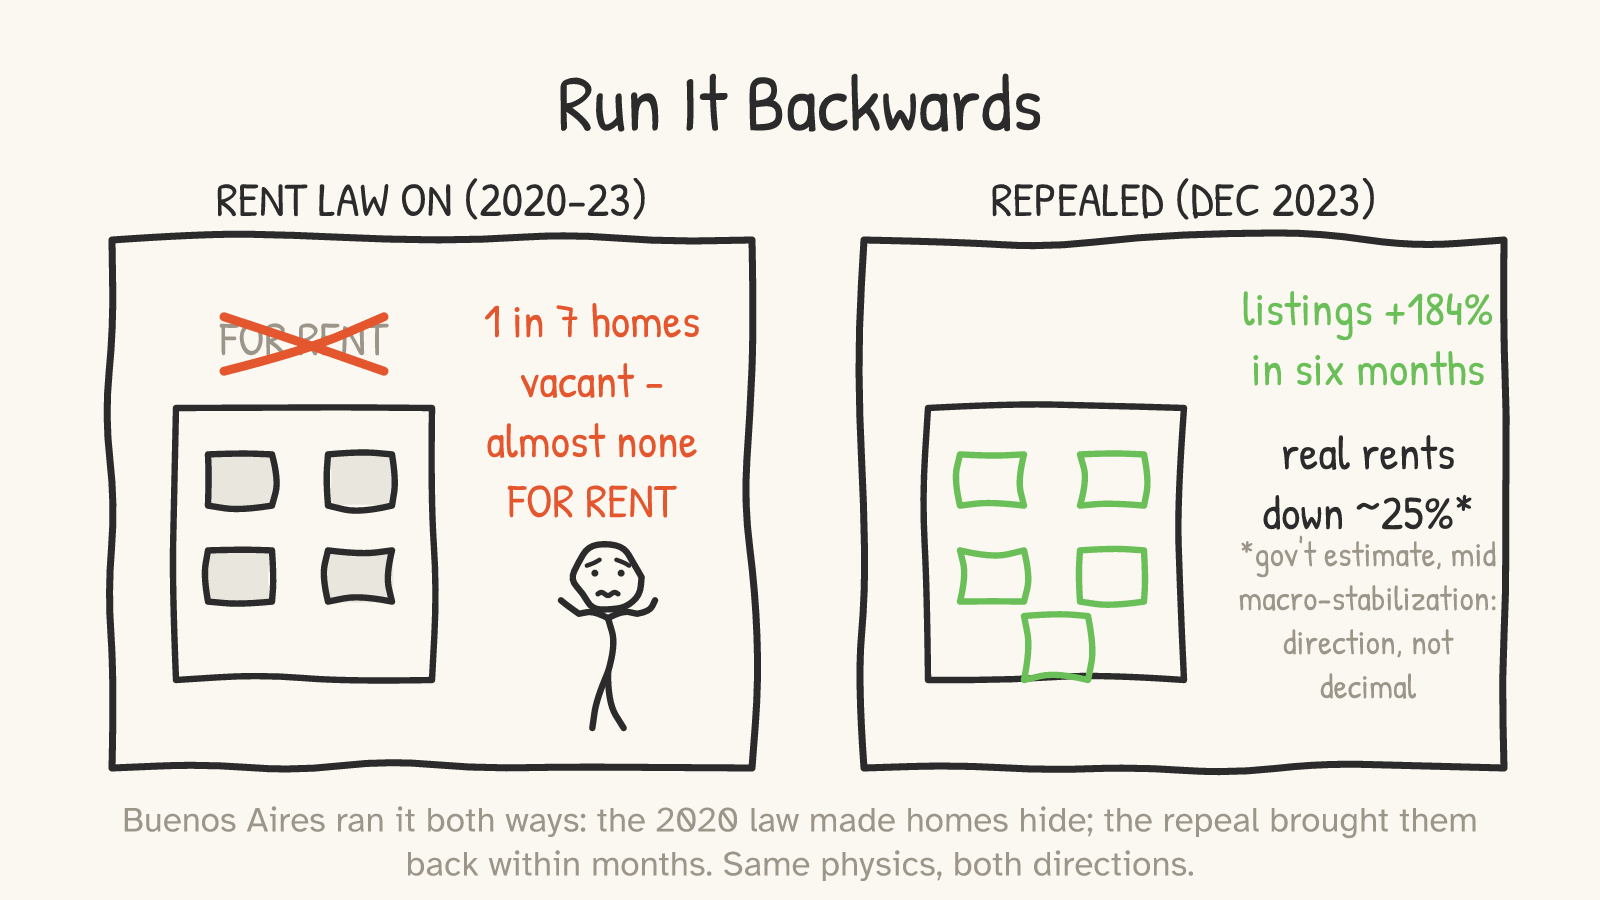
Buenos Aires, 2020–2024. Argentina ran the whole experiment in both directions in four years, which is the kind of thing Argentina does. A 2020 law imposed three-year mandatory contracts with state-indexed adjustments; landlords responded by pulling apartments off the long-term rental market en masse — active listings in Buenos Aires collapsed to a sliver, even as the census counted roughly one in seven Argentine dwellings vacant (a figure that includes ordinary vacancy, but sat uncomfortably beside renters fighting over the listings that remained). In December 2023, the new government repealed the law outright. Within six months, Buenos Aires rental listings had risen by about 184% — the government's count for the metro area says they roughly tripled — and real, inflation-adjusted rents were about a quarter lower by the government's measure.14 Big caveat, stated plainly: this all happened mid-currency-stabilization in the most macro-chaotic country in the hemisphere, the rent figure is the government grading its own reform, and no peer-reviewed study exists yet. Treat the decimals with suspicion. The direction — hidden homes flooding back within months of the cap dying — is hard to argue with, because you can watch it happen on the listing sites.
One mechanism, five cities, eighty years, four continents, both directions. Cap binds → rentals exit, queues and key money bloom, the uncovered market absorbs the pressure and charges for it. Cap dies → the apartments walk back in the door. At some point a pattern this reproducible stops being a debate and starts being a property of the material, like steel rusting in rain.
So why does the idea keep winning elections?
Because of the part that's true.
Part 5The part that's true
Here is the strongest version of the other side, and it deserves better than a strawman, because it's standing on a real finding — the same real finding, from the same gold-standard study this essay has been leaning on.
“Your own headline study found that rent control kept people in their homes — a 20% drop in covered tenants' displacement, concentrated among the old and the long-tenured. That's not a side effect; that's the entire point. A lease isn't a widget; it's the container of a life. Schools, churches, night-shift commutes, the neighbor with the spare key. Rent control is insurance against the catastrophic, community-shredding event of being priced out of your own life — and Diamond, McQuade & Qian proved the insurance pays out. Cambridge proves the other direction: when Massachusetts voters abolished rent control in 1994, rents on formerly controlled units rose toward market — and while no study ever directly tracked the incumbent tenants, nobody serious doubts that a sudden repricing to market pushed at least some long-protected households out.15 Eviction is not a market-clearing event; it's a health event, an education event, a poverty event.16 You're weighing construction permits against grandmothers.”
Concede nearly all of it. The shelter is real. The displacement protection is real and large; the people protected are disproportionately the longest-rooted; the harms of forced moves are documented and ugly; and decontrol genuinely has losers — Cambridge's incumbent renters did not enjoy 1995. Anyone who tells you rent control "doesn't work" without this paragraph is selling something.
But now ask the insurance question you'd ask of any policy: who pays the premium?
Not landlords — not for long. The San Francisco study followed the money: owners responded to the cap by converting and exiting until the tenants' gains were roughly offset by costs that landed on the rest of the rental market — higher rents for everyone outside the umbrella, fewer rental homes to go around, with the authors noting the transfer ran substantially from future renters to incumbent ones.3 Rent control is real insurance with a real payout — funded by an invisible tax on newcomers, the young, the recently divorced, the just-arrived nurse, the kid leaving home. The line outside the door in Panel 4. It is, distributionally, one of the strangest programs democracies keep choosing: a transfer to people defined by already having housing, from people defined by needing it — and within the protected class it isn't even means-tested. New York's stabilized stock shelters plenty of struggling families, and also, famously, a sitting congressman with four regulated apartments.17
And the targeting failure is the answer to the grandmother, too — because we know how to protect her without taxing the queue. Means-tested rental assistance. Cash. Eviction-defense lawyers. Vouchers that travel with the person instead of fusing to the unit. Every one of these shelters the vulnerable tenant out of the public purse — on-budget, visible, voted on — instead of off-budget via a shrinking housing stock. The objection to rent control was never "tenants don't deserve help." It's that rent control is the one form of help whose funding mechanism is making housing scarcer.
One more honest complication before the next objection, because the sharpest tenant advocates will raise it and they're right to: the premium argument needs a comparison class. "Rents 5.1% higher for everyone else" is measured against a market where those apartments stayed rentals — but in a city that refuses to build, the newcomer faces a brutal market either way, and the choice on offer is which group of renters gets crushed, not whether. Conceded. That isn't a case for the cap, though; it's the case that the cap-versus-market debate is the wrong debate in a non-building city — both options ration scarcity, one with money, one with queues and luck. The only configuration where the people at the door actually win appears in Part 8.
Two more objections deserve their day:
“This is all first-generation strawmanning. Modern 'rent stabilization' — moderate caps, vacancy resets, new-construction exemptions — is a different animal. Even some economists (Richard Arnott, most famously) broke from the consensus to say mild second-generation control could be welfare-improving where landlords hold market power.18 Oregon's statewide 7%-plus-inflation cap has produced no visible catastrophe in six years.19”
Partly conceded — more than partly. Arnott's premise isn't crazy: rental markets do have search frictions, moving is costly, information is lopsided, and the recent litigation over landlords' algorithmic pricing tools is exactly an allegation that owners in concentrated markets found ways to price like an oligopoly. Some landlord pricing power, in some tight submarkets, is real. So let's place the evidence precisely instead of swinging it: San Francisco's market satisfies Arnott's demand-side precondition (tight, frictional) — but the regime the 1994 experiment tested had no vacancy reset for sitting tenants' units in the relevant sense Arnott cared about; it was closer to the hard, first-generation design he himself called the bad one. So the Diamond results confirm something Arnott already conceded — hard caps produce supply exits — rather than refuting his preferred mild design. Where does that leave the mild design? Largely untested: the natural experiments that exist are nearly all of harder variants, and the one clean mild case, Oregon, has persisted six years without catastrophe and without measured benefit. The honest scorecard is: hard caps, repeatedly falsified; mild caps, unproven in both directions, with their advertised benefit shrinking exactly as fast as their bite does. Beyond that: the milder the cap, the smaller the promised benefit — a cap that never binds is a placebo, and a placebo was not what St. Paul's voters were promised. And designs wander. New York's "temporary wartime emergency" measure dates to 1943;20 St. Paul went maximal on the first try, and yes, retreated fourteen months later — after the permit collapse, which is the point: the loosening came as tuition paid in damage, and every developer watching now prices in the possibility that any mild cap is one referendum from maximal. Oregon's mild, never-binding-for-most design persisting quietly for six years is the honest counterexample, and it's conceded — though a cap that mostly doesn't bind is mostly not the policy being marched for.
“Economists' consensus, sure. The same Econ-101 confidence said minimum wages must kill jobs, and then Card and Krueger checked, and the textbook was wrong. Why believe the textbook here?"21**”
Because here, checking is exactly what happened. The minimum-wage revision came from natural experiments overturning the diagram. Rent control's natural experiments — San Francisco, Cambridge, Berlin, St. Paul, Buenos Aires — came back agreeing with the diagram, in both directions, with magnitudes. Labor markets turned out to have monopsony power and search frictions that the simple model missed; housing markets turned out to behave embarrassingly like the simple model. Same epistemology, opposite verdict. Trusting the evidence over the diagram is precisely how you end up against rent control.
Part 6But Vienna
Every rent-control argument eventually arrives at Vienna, the renters' Eden: a supermajority of tenants, gorgeous public housing, rents that make visiting Americans weep. If rent control destroys cities, explain Europe's most livable one.
Gladly — because Vienna is not a rent-control story. It's a construction story wearing rent control as a hat.
Vienna's city government owns about 220,000 apartments outright and steers another couple hundred thousand through limited-profit housing associations; together they house roughly three in five Viennese renters. That empire wasn't built by capping private landlords. It was built by a century — literally, the program started in the 1920s — of buying land, taxing for housing, and building seven to ten thousand subsidized homes a year, every year, until the public sector simply out-supplied the shortage.22 Vienna is what it looks like when a government attacks the quantity of housing instead of the price of it. The cap on what Gemeindebau tenants pay is the result of abundant public supply, not a substitute for it — and even Vienna obeys the physics everywhere the supply doesn't reach: its private-market rents have climbed steeply, and its own planners grumble about long-settled insiders rattling around big cheap flats while newcomers pay market rates at the edge of town. Insider/outsider physics, cushioned by abundance.
So yes: be Vienna! Genuinely, it's a fine ambition. But "be Vienna" is an instruction to build publicly at scale for a hundred years — land banks, dedicated taxes, middle-class buy-in. A city that passes a 3% cap and builds nothing has not done the Vienna thing. It has done the Stockholm thing, and Stockholm is a queue.
Part 7The mirror image
Step way back, because rent control turns out to be one half of a symmetrical mistake, and seeing the whole shape is worth one detour.
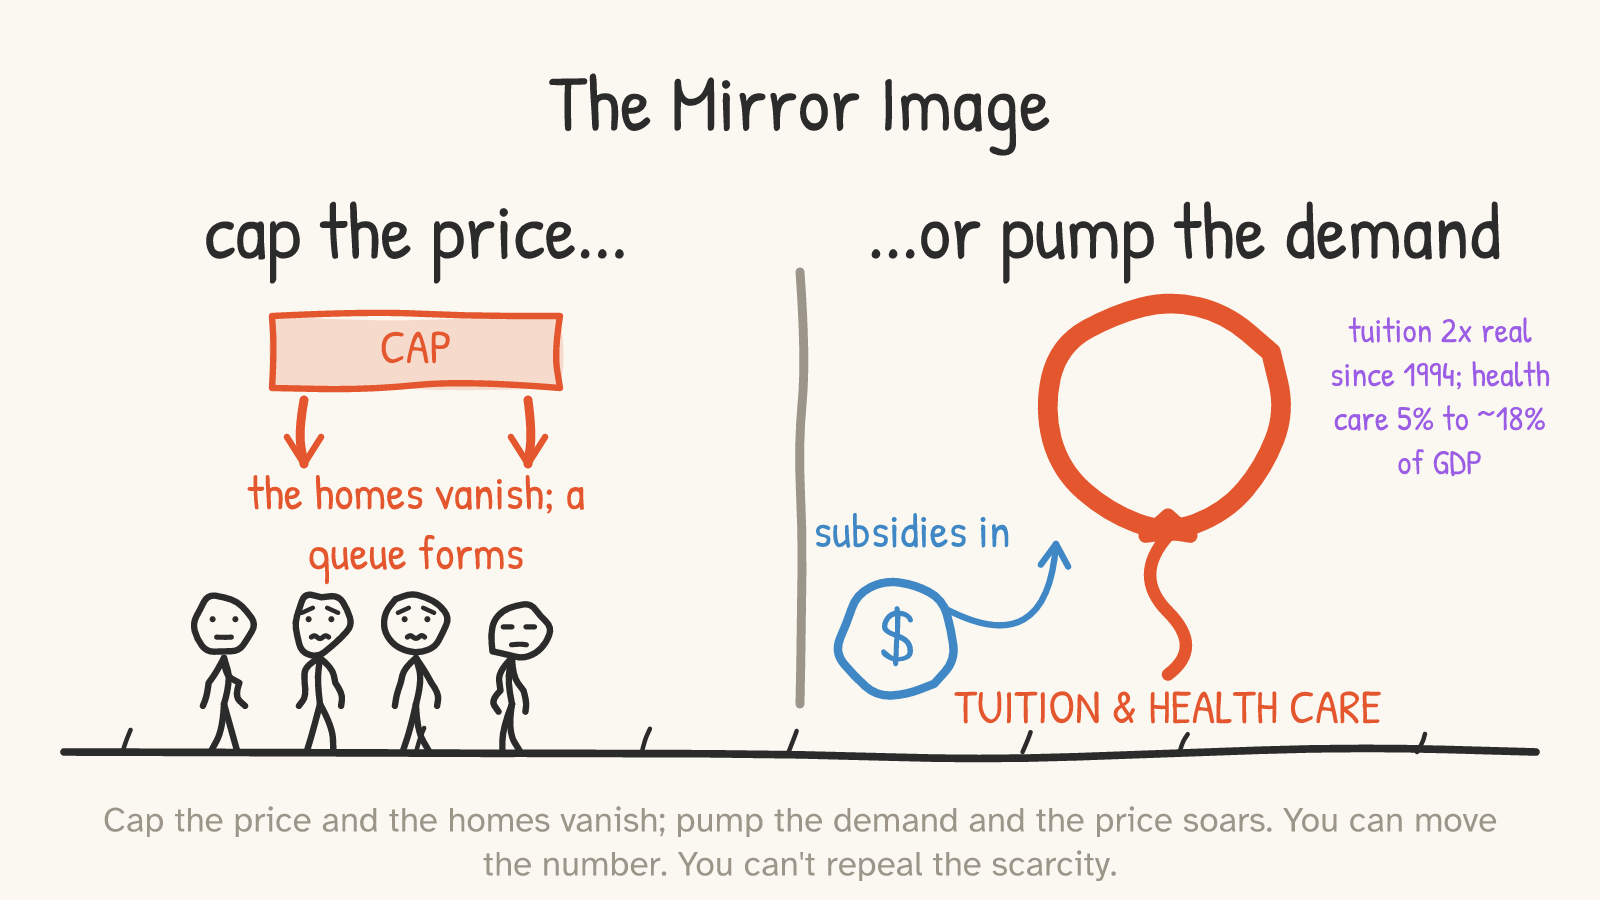
When government wants a price lower, it can push down on the price — a cap. We've spent six parts watching what happens: the good doesn't get cheaper; it gets scarcer, and the cost re-emerges as queues, key money, and decay.
But when government wants more of a good, it more often pushes up — subsidizing demand. Student loans for tuition. Tax-advantaged third-party insurance for health care. And if the supply of the thing can't easily grow — university seats, medical residencies — the subsidy can't become more of the good, so it becomes a higher price for the same good. Published in-state tuition at public four-year colleges has roughly doubled in real, inflation-adjusted terms just since the mid-1990s.23 Health spending went from 5% of US GDP in 1960 to about 18% — over the same era in which the share Americans pay out-of-pocket at the point of care collapsed from about half to about a tenth, with someone-else-pays covering the rest.24 When the New York Fed studied what happens when subsidized federal loan limits rise, it found about 60 cents of each marginal loan dollar passing straight into list tuition — the "Bennett hypothesis," named for the Education Secretary who proposed it in 1987.25 (Scope note, because the two sentences above shouldn't be read as one: the pass-through evidence is strongest at private institutions; the public-college doubling owes a great deal to state funding cuts — a different dysfunction with the same shape, in that the sticker price climbs fastest wherever the student's own check covers the least.)
Now the epistemics, stated as plainly as the claims: the rent-control case in Parts 1–6 rests on natural experiments with clean identification; this section rests on a pattern, and patterns have rival explanations. Health spending's climb owes a great deal to things that have nothing to do with subsidy design — an aging population, and the happy fact that medicine can do vastly more than it could in 1960 and the new powers cost money. And some of both curves is Baumol's famous cost disease: education and medicine are made of human attention, human attention doesn't get more productive the way factories do, so its relative price rises everywhere, subsidy or no subsidy.26 What's left for the subsidy story is the margin where it's actually been tested — and there the evidence is real: the loan-limit studies finding sixty-cent pass-through at the margin are well-identified,25 and the corners of medicine that insurance doesn't touch — cash-pay procedures like LASIK — have seen real prices drift down over decades while quality soared (elective and standardized, yes — the easy case — but a telling one).27 Read this section as pattern-recognition with one proven mechanism inside it, not as a second proof.
Cap a price: the supply walks away, and the shortage is the tax. Pump the demand against capped supply: the price walks away, and the bill is the tax. They are the same error reflected in a mirror — legislating the number while ignoring the quantity — and the same politician can commit both before lunch: a rent cap (price too high! push it down!) and a first-time-homebuyer subsidy (buying too hard! pump it up!), each making the other's disease worse.
You can move a number. You cannot repeal a scarcity. The only thing that repeals a scarcity is more of the thing.
Part 8The only lever that works
Which would be a despairing place to end, except that the lever marked "more of the thing" is sitting right there, and the cities that have pulled it lately keep getting the result the cap kept promising.
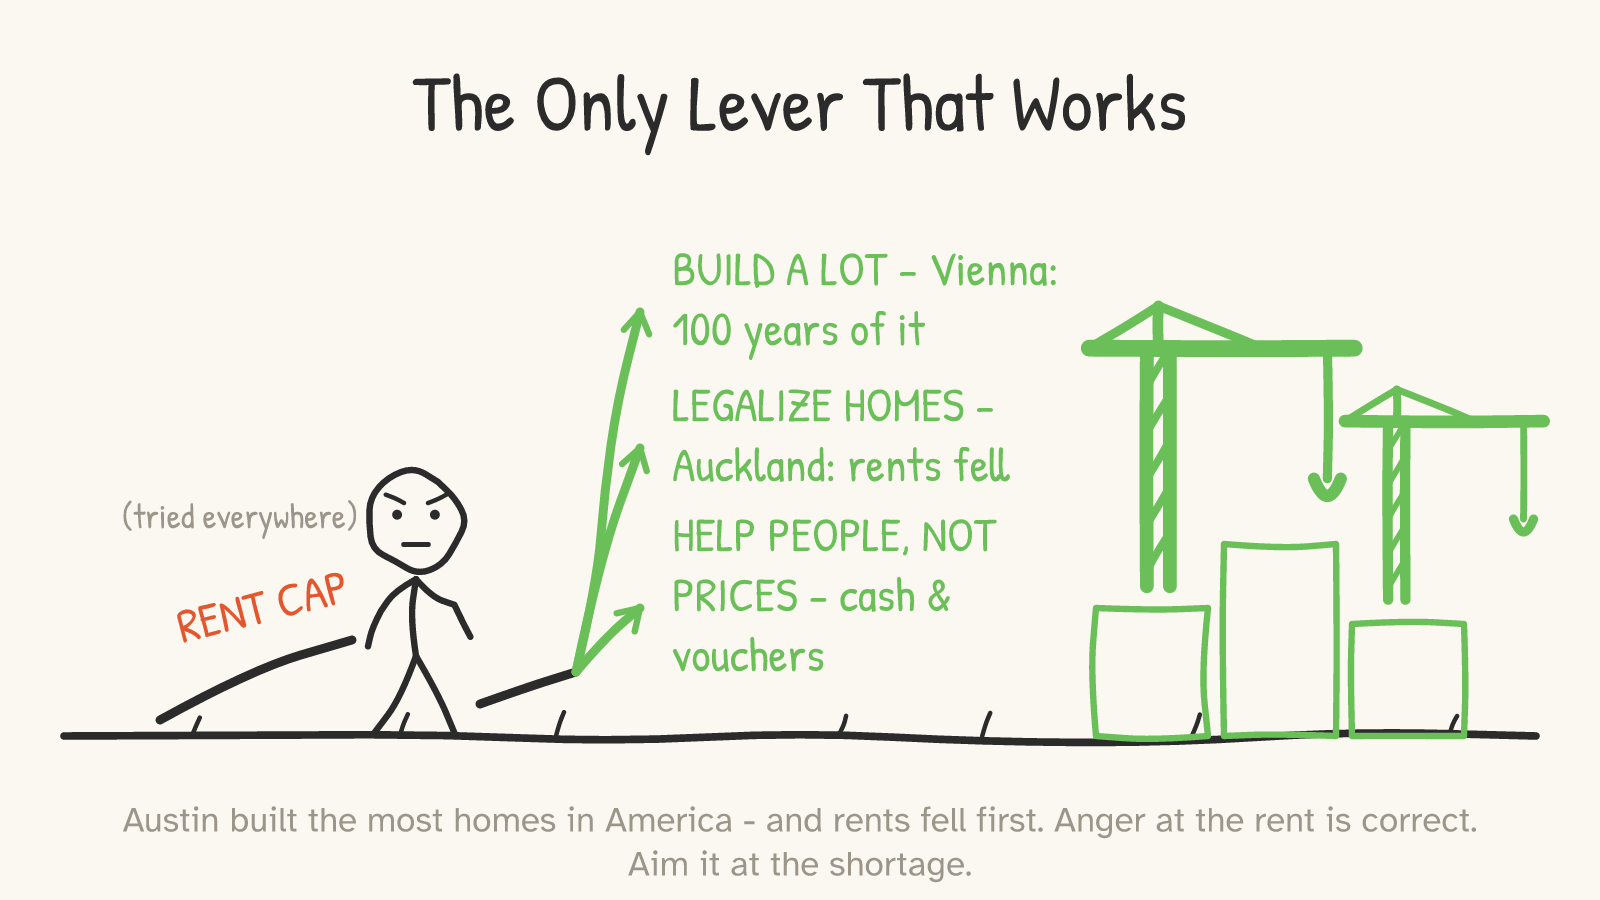
Auckland, hardly anyone's idea of a free-market dystopia, upzoned three-quarters of its residential land in 2016; construction roughly doubled, and peer-reviewed work finds rents well below where comparable cities' trends said they'd be.28 Austin met its pandemic boom by permitting more homes per capita than any big metro in America, and was rewarded with the thing American cities supposedly can't have: rents that fell, in nominal dollars, for two years straight — while coastal cities with strong tenant protections and weak construction watched rents grind upward.29 Tokyo, which permits housing nationally and ignores neighborhood vetoes, has spent decades absorbing population growth that would detonate a US coastal city, at rents that have barely moved in real terms.30 And the mechanism is no mystery: new buildings — even expensive ones — start "moving chains," each new household leaving behind a cheaper unit for the next, measurably loosening the bottom of the market within a few years.31
Note what this implies about timing, because "build more" gets dismissed as a someday answer while the cap is sold as relief now. Auckland's rents bent within about five years; Austin's within two. St. Paul's permits collapsed within five months. The cap is not faster than building. The cap is slower than building and pointed backward — and the people it shelters now are billed to a queue that compounds for decades. Meanwhile the genuinely now-shaped tools — emergency rental cash, vouchers, eviction defense — act in weeks and shrink nothing.
So the redirect, and then we're done:
The anger in that first panel — the envelope, the 18% — is correct. Every bit of it. The rent really is too damn high, somebody really is profiting from a shortage, and a city that shrugs at that deserves the politics it gets. The only quarrel this essay has ever had is with the target. The landlord's price is the messenger; the shortage is the message; and for eighty years the cap has been a vote to shoot the messenger and keep the shortage. Aim the same anger at the zoning map, the permit queue, the empty lot fight, the hundred-year Vienna project your city never started — at the quantity — and the price, which never once obeyed a statute, obeys the only thing it has ever obeyed.
More homes. Help people with money while the cranes work. That's the whole program. The queue was never the way to make housing cheap. The queue is the price.
Footnotes & receipts
- Recent US rent-control politics: Biden administration proposal (July 2024) for a 5% cap on rent increases by landlords with 50+ units, tied to tax treatment — announced, never enacted. California Propositions 10 (2018), 21 (2020), and 33 (2024) — each would have expanded local authority to impose rent control by repealing/amending Costa-Hawkins; each rejected by voters. Zohran Mamdani's winning 2025 NYC mayoral platform included freezing rents on the ~1 million stabilized units. Press/government record (tier 2/4). ↩
- Friedman & Stigler, "Roofs or Ceilings? The Current Housing Problem" (Foundation for Economic Education pamphlet, 1946), on San Francisco's WWII-era controls; their comparison baseline was the uncontrolled post-1906-earthquake housing response. Historical argument, pre-econometric (tier 3, historical color only — no numbers in this essay rest on it). ↩
- Diamond, McQuade & Qian, "The Effects of Rent Control Expansion on Tenants, Landlords, and Inequality: Evidence from San Francisco," American Economic Review 109(9), 2019 (tier 1). Quasi-experiment from the 1994 ballot extension of rent control to ≤4-unit pre-1980 buildings. Key estimates used here: covered tenants' mobility reduced ~20% (displacement protection concentrated in older/longer-tenured households); treated landlords reduced rental supply ~15% (condo conversion, owner-occupancy, redevelopment); citywide market rents ~5.1% higher in the long run via the supply channel; authors' welfare accounting finds tenant gains roughly offset by losses borne by future/uncovered renters ("transfer between future renters and renters in 1994"), with the law "ultimately undermining" its goals. The 5.1% and the welfare offset are model-based general-equilibrium estimates, not raw differences — stated as such here. ↩
- IGM Economic Experts Panel (Chicago Booth), February 2012 question on whether rent-control ordinances (NYC/SF style) "have had a positive impact over the past three decades on the amount and quality of broadly affordable rental housing": 2% of panelists agreed, 81% disagreed, remainder uncertain/no answer; disagreement is higher still when weighted by self-reported confidence. We cite the raw, lower figure (tier 3). ↩
- Literature surveys (tier 1/3): Turner & Malpezzi, Swedish Economic Policy Review (2003) — supply, mobility, and maintenance losses, poorly targeted benefits; Jenkins, Econ Journal Watch (2009) — near-consensus on supply/quality effects; Kholodilin's cross-country surveys of rent regulation (Journal of Housing Economics, 2020s) — regulated rents fall, unregulated rents rise, supply falls. Survey conclusions, pre-dating and consistent with the natural-experiment papers cited individually. ↩
- Assar Lindbeck, The Political Economy of the New Left: An Outsider's View (Harper & Row, 1972; the remark dates to 1971). Wording per the book as standardly cited; variants circulate. Lindbeck chaired the Nobel economics prize committee and was a Swedish social democrat — cited here precisely because he was no movement libertarian. (A more famous quote — a Vietnamese official crediting low rents with destroying Hanoi better than American bombs — circulates widely; it has never been traced past a 1989 secondhand account, so it does not appear in this essay's argument.) ↩
- Stockholm Housing Agency (Bostadsförmedlingen i Stockholm) official queue statistics, 2023 (tier 2): ~9 years average queue time for a successful contract, most falling between ~5 and ~13 years; inner-city averages 15–20 years; student housing ~4.5 years; queue membership over 700,000. Stockholm municipality population ≈ 0.98M — the queue approaches three-quarters of the city's population, though it includes county residents and pre-emptive joiners (Swedes commonly enroll their teenagers), which is itself evidence of the dysfunction. ↩
- KTH Royal Institute of Technology working-paper analysis of Stockholm queue administrative data, 2003–2023 (tier 3, working paper): share of new rental contracts going to ages 18–30 fell 12.7% → 4.4%; share to 60+ rose 4.9% → 22.2%. ↩
- Glaeser & Luttmer, "The Misallocation of Housing Under Rent Control," American Economic Review 93(4), 2003 (tier 1): structural estimate that NYC rent regulation assigns apartments badly enough (size/location vs. household) to generate welfare losses estimated in the hundreds of millions to ~$2B/year range; sensitive to preference-model assumptions, cited here as mechanism-plus-order-of-magnitude, not a precise figure. Key-money/black-market contracts in Stockholm: documented qualitatively (Swedish press, government inquiries); scale unquantified (tier 5 — no number rests on it). ↩
- Munch & Svarer, "Rent Control and Tenancy Duration," Journal of Urban Economics 52(3), 2002 (tier 1): Danish tenancies in the most-regulated units last ~6 years longer than comparable least-regulated tenancies; survival analysis exploiting within-Denmark regulation variation. ↩
- Maintenance/quality under controls (tier 1): Gyourko & Linneman, Journal of Urban Economics (1990) — significantly worse quality in NYC's controlled stock, cross-sectional methods of the era; corroborated causally by the Cambridge investment response in note 15 (renovation permits surged after decontrol). ↩
- Berlin Mietendeckel (Feb 2020 – Apr 2021), DIW Berlin analyses (Kholodilin et al.) of listing data (tier 1/3): advertised rents on covered (pre-2014) units ≈ −11% vs. control; rental listings down >50% during the cap; uncovered post-2014 segment rents ≈ +12% (Mense–Michelsen–Kholodilin, market segmentation analyses). Post-ruling non-recovery: ifo Institute (2022) reported Berlin rental listing volumes still far below pre-Mietendeckel baseline (~60% down on ifo's series) a year after the Federal Constitutional Court voided the law — note this is a different listings series/methodology than DIW's during-cap estimate, so the two percentages should not be read as one trajectory against one baseline; the conservative, source-robust claim (used in text) is that listings did not recover for at least a year. Listings ≠ leases; all these effects are on the advertised market, the margin newcomers face. ↩
- St. Paul (tier 2/4): multifamily units permitted, November–March window, 1,895 (2020–21) → 248 (2021–22), per city permit records compiled by MinnPost and Center of the American Experiment (−87%; "more than 80%" in text); Minneapolis multifamily permitting rose over the same window — imperfect control given its 2019/2040 rezoning. January 2023 amendments exempted new construction for 20 years (rolling) and widened pass-throughs. Property-value effect: Ahern & Giacoletti, working paper (SSRN, 2022/23 — not yet peer-reviewed): ~4–6% decline in covered residential property values, poorly targeted transfer. ↩
- Argentina (tier 4 — portal and government data; no peer-reviewed study yet): 2020 Ley de Alquileres (3-year contracts, indexed adjustments); by late 2023 ~1 in 7 dwellings nationally vacant per census/press estimates — a figure that includes ordinary frictional/seasonal vacancy and is not itself a measured policy effect; the policy-shaped fact is the collapse of active long-term listings alongside it. Milei's DNU 70/2023 (Dec 2023) deregulated contracts. Post-repeal: Buenos Aires listings +184% by June 2024 (Zonaprop, via press); Ministry of Deregulation reported metro-area supply +212% Dec 2023→mid-2024; government estimate of real (inflation-adjusted) rents ≈ −27% over the first seven months (panel rounds conservatively to ~25%; consistent with Zonaprop's nominal +61% in 2024 against ~120%+ CPI). All amid drastic macro-stabilization — direction robust across sources, decimals not. ↩
- Autor, Palmer & Pathak, "Housing Market Spillovers: Evidence from the End of Rent Control in Cambridge, Massachusetts," Journal of Political Economy 122(3), 2014 (tier 1): 1994's statewide Question 9 (passed 51%) ended rent control Jan 1995; decontrol added ≈ $1.8B (≈ a quarter of all Cambridge residential appreciation 1994–2004), with more than half the gain accruing to never-controlled neighboring properties — the spillover; renovation investment rose sharply but explains only ~a quarter of the formerly-controlled gain. Note the $1.8B is capitalized property value — captured by owners, not renters; it's cited as the measure of how much activity the cap had been suppressing, not as a renter benefit. Incumbent-tenant costs: rents on decontrolled units rose toward market; no study directly tracked incumbent-household outcomes (a real gap — the body's displacement statement is explicitly inference, and labeled as such). ↩
- Displacement externalities (tier 1/3): Desmond, Evicted (2016) and the eviction-outcomes literature (health, schooling, job loss); UC Berkeley Urban Displacement Project on gentrification-driven displacement. Cited as the moral weight behind the insurance argument — the steelman's best evidence. ↩
- Targeting (tier 3/4): NYU Furman Center HVS tabulations — most NYC stabilized tenants are lower-income, but a substantial minority are middle-to-high income; regulation attaches to units, not means. Rep. Charles Rangel's four rent-stabilized Lenox Terrace apartments: New York Times reporting (2008). ↩
- Arnott, "Time for Revisionism on Rent Control?" Journal of Economic Perspectives 9(1), 1995 (tier 1): theoretical case that mild second-generation stabilization can improve welfare under landlord market power/search frictions. The leading academic dissent, engaged in text. ↩
- Oregon SB 608 (2019): first statewide cap, 7% + CPI annually, buildings <15 years exempt, vacancy reset preserved; tightened 2023 (SB 611: lesser of 10% or 7%+CPI, with exemptions). No publication-quality causal study of its supply effects existed as of this writing (tier 2 for the law; the absence of evidence is stated as such). ↩
- NYC rent control's lineage runs to the federal Emergency Price Control Act (1942) and continuous state/city successor regimes from 1943 onward; Sweden's to 1942. "Temporary" is the genre's oldest joke (tier 2, statutory history). ↩
- Card & Krueger, American Economic Review (1994), New Jersey/Pennsylvania minimum-wage natural experiment; subsequent decades of mixed-but-revisionist employment findings. The analogy and its limits are argued in text: housing's natural experiments confirmed rather than overturned the standard model. ↩
- Vienna (tier 2/3): ~220,000 city-owned (Gemeindebau) dwellings plus ~200,000 limited-profit-association units ≈ roughly 60% of Vienna renters in the social/cost-rent sector; sustained subsidized construction on the order of 7,000–10,000 units/year; program founded in the 1920s ("Red Vienna"), financed by dedicated housing levies and century-long municipal land banking (City of Vienna; OECD housing reviews). Same sources document rising private-segment rents and low within-sector mobility (insider effects). ↩
- College Board, Trends in College Pricing and Student Aid 2024 (tier 3): average published in-state tuition & fees at public four-year institutions rose from $5,740 (1994–95) to $11,610 (2024–25) in constant 2024 dollars — a 2.02× real increase. (Longer-horizon "3–4× since 1980" figures circulate from secondary compilations; we cite only the multiple traceable to College Board's current tables.) Published ≠ net price; net price (after aid) rose less — consistent with the aid-capture argument in text. ↩
- CMS National Health Expenditure Accounts (tier 2): NHE ≈ 5.0% of GDP (1960) → ~17–18% (2020s); out-of-pocket share of national health spending ≈ 48% (1960) → ~10–11% (2020s). ↩
- Bennett, "Our Greedy Colleges," NYT (Feb 18, 1987) — the hypothesis. Evidence: Lucca, Nadauld & Shen, Review of Financial Studies (2019) — ~60¢ of each marginal subsidized-loan dollar passed through to sticker tuition (identification from staggered federal loan-limit changes; heterogeneity across institution types per the paper, not characterized here); Cellini & Goldin, AEJ: Economic Policy (2014) — federal-aid-eligible for-profit programs charge ~$1,800/yr more than identical ineligible programs (tier 1). ↩
- Baumol & Bowen (1966); Baumol, The Cost Disease (2012). The honest confounder, conceded in text: labor-intensive services rise in relative price economy-wide, independent of subsidy. ↩
- LASIK and cosmetic-procedure pricing: industry surveys (e.g., ASPS annual statistics) showing roughly flat-to-declining real prices over two decades amid large quality gains; cash-pay markets (tier 4 — directional claim only, and the selection critique — elective, standardized, shoppable — is conceded in text). ↩
- Auckland Unitary Plan (2016) upzoning: Greenaway-McGrevy & co-authors (University of Auckland; peer-reviewed in Economic Policy / Journal of Urban Economics family journals) — construction roughly doubled and rents fell substantially relative to synthetic-control counterfactuals within ~5 years (tier 1). ↩
- Austin 2023–24 (tier 4): led large US metros in housing permits per capita; market rents fell nominally for ~2 consecutive years (Apartment List, CoStar series, widely reported). Correlation with the construction boom — a demand cooldown contributed; cited as illustration alongside the causal Auckland evidence, not as a substitute for it. ↩
- Tokyo (tier 3, descriptive): national-level permissive zoning, high construction rates, decades of roughly flat real rents despite population growth — standard comparative-housing-policy references. ↩
- Mast, "JUE Insight: The Effect of New Market-Rate Housing Construction on the Low-Income Housing Market," Journal of Urban Economics (2021) (tier 1): moving-chain evidence that new market-rate buildings free up substantial numbers of lower-cost units within a few years ("filtering"). ↩